pdf, 21.16 MB
pdf, 21.16 MB

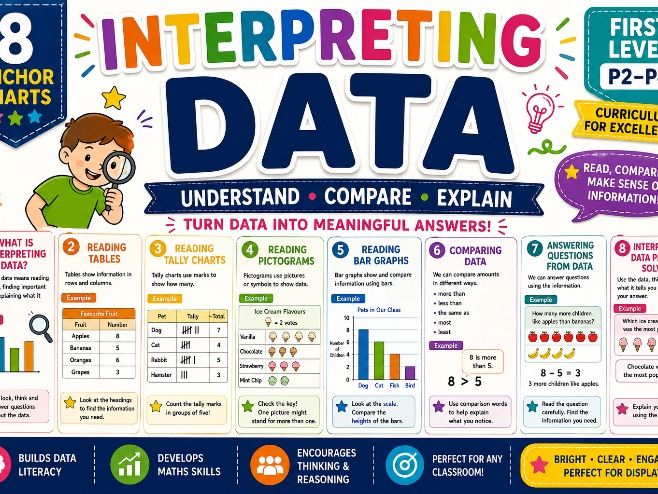
A bright and engaging set of 8 Interpreting Data Anchor Charts designed for pupils working within First Level Curriculum for Excellence.

This colourful, child-friendly resource helps learners develop confidence when reading, comparing and interpreting information presented in tables, tally charts, pictograms and bar graphs. Pupils are supported to identify the most and least, compare values, calculate simple differences and totals, answer questions from data and explain what the information shows.

Each poster uses clear explanations, visual examples, simple mathematical vocabulary and practical questions to support understanding and independent learning.

WHAT IS INCLUDED?
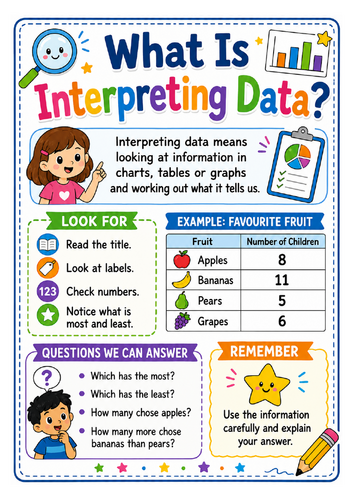
What Is Interpreting Data?
Reading Tables
Reading Tally Charts
Reading Pictograms
Reading Bar Graphs
Comparing Data
Answering Questions from Data
Interpreting Data Problem Solving

SKILLS COVERED
Understanding what it means to interpret data
Reading titles and headings
Reading rows and columns in tables
Finding information in a table
Reading tally marks
Counting tally marks in groups of five
Finding totals from tally charts
Reading pictogram keys
Counting symbols accurately
Understanding when one symbol represents more than one item
Reading bar graph titles, labels and scales
Comparing bar heights
Identifying the most and least
Comparing two or more values
Using the words more, fewer, most, least and equal
Finding simple differences
Finding totals
Answering “how many?” questions
Answering “how many more?” and “how many fewer?” questions
Using data as evidence
Explaining answers clearly
Choosing relevant information from a chart or table
Solving simple data-handling problems
Developing mathematical reasoning
Building confidence with data literacy

EACH ANCHOR CHART FEATURES
Bright, primary-friendly design
Clear child-friendly explanations
Colourful tables, charts and graphs
Worked examples
Step-by-step strategies
Key mathematical vocabulary
Helpful “Look For” prompts
Question examples
Comparison language
Problem-solving support
Visual reminders
Consistent classroom-friendly layout

PERFECT FOR
P2–P4
First Level Numeracy and Mathematics
Data and Analysis
Maths working walls
Classroom displays
Whole-class teaching
Guided maths
Independent pupil reference
Data-handling lessons
Revision and consolidation
Supporting visual learners
Early finishers
Additional support and intervention
Developing reasoning and problem-solving skills
Building confidence when reading graphs and tables

Curriculum: Curriculum for Excellence
Level: First Level
Suggested Stage: P2–P4
Subject: Numeracy and Mathematics
Topic: Interpreting Data
Pages: 8

A practical and colourful classroom resource for helping pupils confidently read, compare, interpret and answer questions from data presented in a range of simple tables, tally charts, pictograms and bar graphs.

Get this resource as part of a bundle and save up to 64%

A bundle is a package of resources grouped together to teach a particular topic, or a series of lessons, in one place.

Bundle

Data Handling KS1/First Level Anchor Chart Bundle

A bright and comprehensive collection of 40 Information Handling Anchor Charts designed for pupils working within First Level Curriculum for Excellence. This colourful, child-friendly bundle brings together 5 complete maths packs, covering Data Handling, Tally Marks & Tables, Pictograms/Bar Graphs/Carroll & Venn Diagrams, Interpreting Data, and Chance & Uncertainty. The posters support pupils as they learn to collect, organise, represent, read, compare and interpret information, as well as explore likelihood, make predictions and investigate simple chance events. With clear explanations, colourful examples, key vocabulary and practical problem-solving opportunities, the bundle is ideal for building a complete Information Handling maths working wall. WHAT IS INCLUDED? DATA HANDLING – 8 ANCHOR CHARTS What Is Data Handling? Collecting Data Tally Charts Tables Pictograms Bar Graphs Interpreting Data Data Handling Problem Solving TALLY MARKS & TABLES – 8 ANCHOR CHARTS What Are Tally Marks? Counting with Tally Marks Reading Tally Charts Making a Tally Chart What Is a Table? Reading and Making Tables Using Tallies and Tables Together Interpreting Tallies and Tables PICTOGRAMS, BAR GRAPHS, CARROLL & VENN DIAGRAMS – 8 ANCHOR CHARTS What Is a Pictogram? Reading and Making Pictograms What Is a Bar Graph? Reading Bar Graphs What Is a Carroll Diagram? Sorting with Carroll Diagrams What Is a Venn Diagram? Sorting with Venn Diagrams INTERPRETING DATA – 8 ANCHOR CHARTS What Is Interpreting Data? Reading Tables Reading Tally Charts Reading Pictograms Reading Bar Graphs Comparing Data Answering Questions from Data Interpreting Data Problem Solving CHANCE & UNCERTAINTY – 8 ANCHOR CHARTS What Is Chance? Chance Words Certain & Impossible Likely, Unlikely & Even Chance Chance with Coins, Dice & Spinners Ordering Events by Chance Trying a Chance Experiment Using What We Know: Chance & Uncertainty SKILLS COVERED Understanding data and information Asking questions and carrying out simple surveys Collecting and recording information Counting and recording with tally marks Grouping tallies in fives Reading and creating tally charts Organising information into tables Understanding rows, columns and headings Reading information from tables Reading and creating pictograms Using pictogram keys Reading simple bar graphs Understanding titles, labels, axes and scales Comparing information represented in different ways Identifying most and least Finding totals and differences Answering “how many?”, “how many more?” and “how many fewer?” questions Sorting information using Carroll diagrams Using two criteria to classify information Sorting and comparing information using Venn diagrams Understanding overlapping groups Interpreting charts, tables and graphs Drawing conclusions from data Using evidence to explain answers Solving data-handling problems Understanding chance and uncertainty Using certain, likely, unlikely and impossible Understanding even chance Comparing likelihood Ordering events by chance Using simple chance lines Making predictions Exploring chance with coins, dice and spinners Carrying out simple chance experiments Recording and comparing results Developing mathematical reasoning and problem-solving skills EACH ANCHOR CHART FEATURES Bright, primary-friendly design Clear child-friendly explanations Consistent visual style throughout the bundle Colourful charts, tables and diagrams Simple worked examples Key mathematical vocabulary Step-by-step strategies Helpful reminders and top tips Practical classroom examples Real-life connections Questions to encourage mathematical discussion Problem-solving opportunities Visual support for independent learning PERFECT FOR P2–P4 First Level Numeracy and Mathematics Curriculum for Excellence Information Handling Data and Analysis Ideas of Chance and Uncertainty Maths working walls Classroom displays Whole-class teaching Guided maths Independent pupil reference Practical maths investigations Revision and consolidation Supporting visual learners Early finishers Additional support and intervention Developing mathematical vocabulary Building reasoning and problem-solving skills Curriculum: Curriculum for Excellence Level: First Level Suggested Stage: P2–P4 Subject: Numeracy and Mathematics Curriculum Area: Information Handling Complete Resource Packs: 5 Anchor Charts: 40 Pages: 40 A comprehensive, ready-to-use First Level Information Handling resource that supports pupils from their first experiences of collecting and displaying data through to interpreting information, solving problems and exploring chance and uncertainty. The consistent, colourful design makes the complete bundle perfect for creating an engaging maths working wall while giving pupils accessible visual support throughout their learning.

£5.00

Reviews

Something went wrong, please try again later.

This resource hasn't been reviewed yet

To ensure quality for our reviews, only customers who have purchased this resource can review it

Report this resourceto let us know if it violates our terms and conditions.
Our customer service team will review your report and will be in touch.