

Teach your students how development is really measured with this fully resourced Geography lesson.
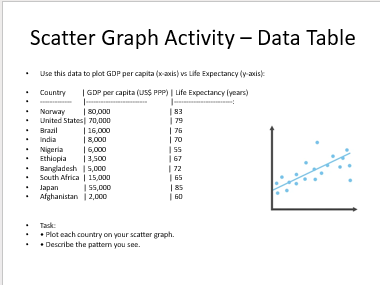
This engaging lesson introduces key indicators of development – GDP per capita, life expectancy, literacy rate and HDI – through interactive activities, real-world data and clear visuals. Students rank countries, plot scatter graphs and analyse patterns to understand how social and economic factors combine to measure development. The download includes a ready-to-use PowerPoint, a differentiated student worksheet with data tables and graph templates, plus plenary quizzes and homework tasks. Perfect for building data-handling and critical thinking skills, and ideal as part of a full “Development” unit or as a stand-alone lesson.
Get this resource as part of a bundle and save up to 62%
A bundle is a package of resources grouped together to teach a particular topic, or a series of lessons, in one place.
Bundle
KS3 Development Unit Assessment and Knowledge Organiser
This complete 7-lesson unit introduces students to the key ideas of global development through engaging, accessible, and visually rich lessons. Beginning with What is Development? and progressing through how it is measured, why it is uneven, and how it affects Standard of Living (SOL) and Quality of Life (QOL), students explore real-world contrasts using up-to-date global and regional case studies — including India as a Newly Emerging Economy and comparisons with the UK. Each lesson includes a fully editable PowerPoint, differentiated worksheets, data interpretation tasks, model answers, assessment criteria, and teacher guidance. The final evaluation lesson asks students the big question: Does economic growth always improve quality of life? — developing their analytical writing and evaluative thinking in preparation for GCSE Geography. Perfect for KS3 Geography, this unit builds key skills in understanding inequality, interpreting data, and linking development to people’s everyday lives. Also includes an assessment covering the unit content with mark scheme, model answer and Knowledge Organiser for revision.
£7.00
Bundle
Development
This complete 7-lesson unit introduces students to the key ideas of global development through engaging, accessible, and visually rich lessons. Beginning with What is Development? and progressing through how it is measured, why it is uneven, and how it affects Standard of Living (SOL) and Quality of Life (QOL), students explore real-world contrasts using up-to-date global and regional case studies — including India as a Newly Emerging Economy and comparisons with the UK. Each lesson includes a fully editable PowerPoint, differentiated worksheets, data interpretation tasks, model answers, assessment criteria, and teacher guidance. The final evaluation lesson asks students the big question: Does economic growth always improve quality of life? — developing their analytical writing and evaluative thinking in preparation for GCSE Geography. This unit builds key skills in understanding inequality, interpreting data, and linking development to people’s everyday lives.
£4.00
Something went wrong, please try again later.
This resource hasn't been reviewed yet
To ensure quality for our reviews, only customers who have purchased this resource can review it
Report this resourceto let us know if it violates our terms and conditions.
Our customer service team will review your report and will be in touch.
£1.50