


AQA GCSE Geography lesson for the new specification Unit 2A: In this lesson we look at how Lagos has grown in the last 50 years and why.
We start with a population pyramid of Nigeria and the pupils can choose questions to answer as we explore the population structure of the country.
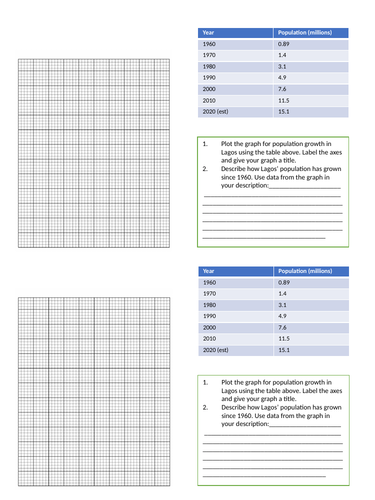
We then look at the growth of Lagos through the pupils plotting the data onto a graph and answering questions about Lagos’ population growth. We then move onto the physical growth of the city. Here pupils use colours to make an isoline map and again there are questions for the pupils to answer. We then look at push & pull factors for rural-urban migration. The pupils create a graph as a visual tool to see which are the main pull and push factors. We finish with an emoji annotation plenary about the reasons for Lagos’ population growth.
In a nutshell lesson includes:
Population pyramid starter
Video clip
Graph plotting task with questions on population data.
Isoline map task with questions.
Push-pull factors bar chart.
Annotating emojis plenary.
Hope this saves you some valuable planning time.
https://www.tes.com/teaching-resources/shop/markthegeographer
Get this resource as part of a bundle and save up to 46%
A bundle is a package of resources grouped together to teach a particular topic, or a series of lessons, in one place.
Bundle
AQA GCSE: The Urban World & Lagos Case Study All Lessons
Complete bundle for the AQA GCSE Geography 2016 specification Unit 2a The Urban World using Lagos, Nigeria, as a case study. All lessons have a variety of differentiated activities, skills tasks, video clips. exam-style questions with guidance and photocopying/printing ready worksheets and handouts. The order of the lessons is 1. Urbanisation: An Increasingly Urban World 2. Megacities: The Emergence of Megacities 3. Introducing Lagos 4. Growing Lagos 5. Social Challenges in Lagos 6. Economic Challenges In Lagos 7. Improving Lagos' Environment 8. Squatter Settlements in Lagos 9. Urban Planning in Lagos I hope this saves you valuable planning time! https://www.tes.com/teaching-resources/shop/markthegeographer
£10.00
Bundle
AQA GCSE Geography : Lagos All Lessons
This bundle includes all lessons on Lagos for the AQA specification Unit 2 section A. Lessons include a variety of activities, video clips, exam-style questions and worksheets ready to print or copy. the sequence of lessons is : 1. Introducing Lagos 2. Growing Lagos 3. Social challenges in Lagos 4. Economic challenges in Lagos 5. Improving Lagos' environment 6. Managing Squatter Settlements in Lagos 7. Urban planning in Lagos Hope this saves you some valuable planning time. https://www.tes.com/teaching-resources/shop/markthegeographer
£7.50
Something went wrong, please try again later.
This resource hasn't been reviewed yet
To ensure quality for our reviews, only customers who have purchased this resource can review it
Report this resourceto let us know if it violates our terms and conditions.
Our customer service team will review your report and will be in touch.
£2.00