

Handling data (two days).
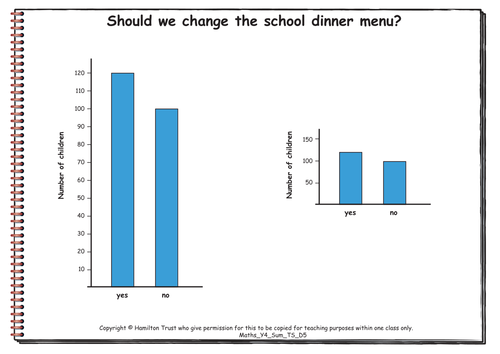
Children roll pairs of dice, find the differences or totals, recording the results in a tally chart. They discuss what they learn from the resulting table about the frequency of each score and reason why this might be the case. They find the totals of spinners to find out if a game is fair and draw a bar chart to show the results, choosing their own scale for the vertical axis. Bar charts of the same data but with different step intervals are discussed.
Find additional lesson plans and resources at www.hamilton-trust.org.uk.
Something went wrong, please try again later.
Clear, easy to follow planning with useful resources.
Report this resourceto let us know if it violates our terms and conditions.
Our customer service team will review your report and will be in touch.
£0.00