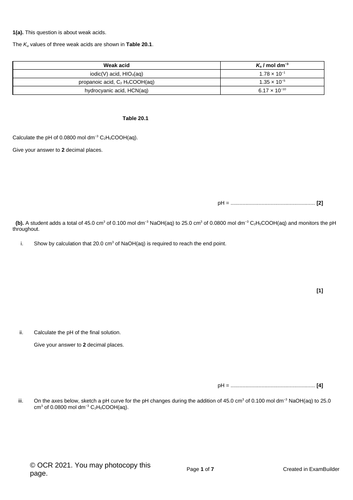


This is a complete lesson covering sections 5.1.3 n and o of the OCR A level Chemistry specification- Neutralisation. The lesson opens by considering the use of a pH meter to track a neutralisation reaction. This also includes data for plotting a pH curve. It then moves on to looking at the end point of a titration as well as the equivalence point. It explains the colour change that occurs at the end point and why it happens. The final part of the lesson considers different indicators and how to choose which would be the best to use for each titration. The final activity is an exam question.
The lesson includes a starter, full notes, various student led activities and a differentiated summary at the end.
All answers are included.
I actively try to reduce photocopying, so most of the lesson resources are within the PowerPoint rather than as extra sheets.
Something went wrong, please try again later.
This resource hasn't been reviewed yet
To ensure quality for our reviews, only customers who have purchased this resource can review it
Report this resourceto let us know if it violates our terms and conditions.
Our customer service team will review your report and will be in touch.