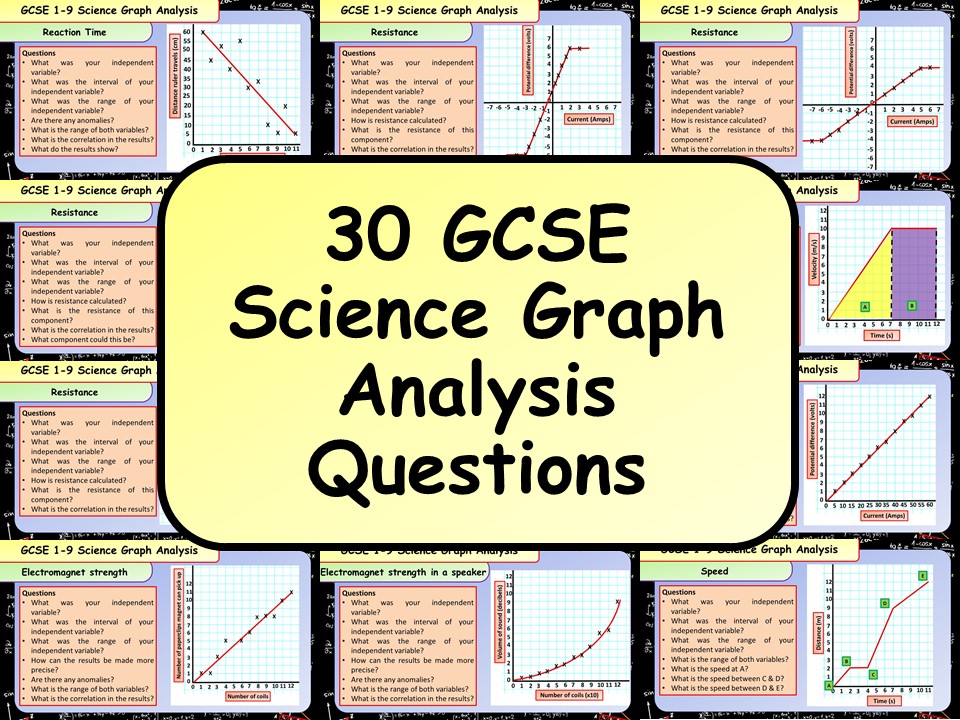
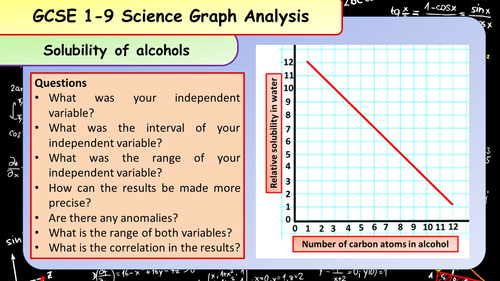
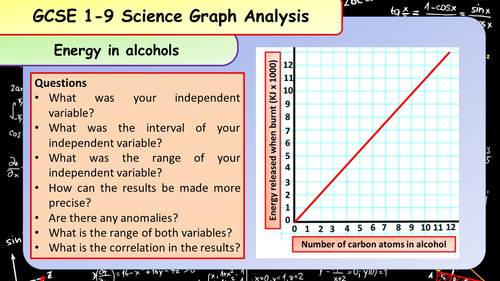
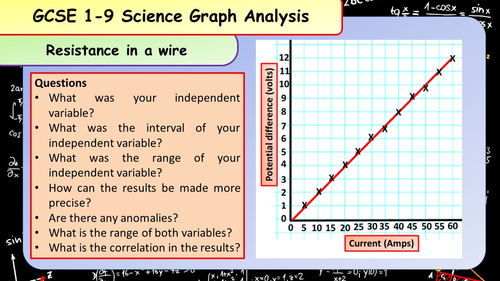
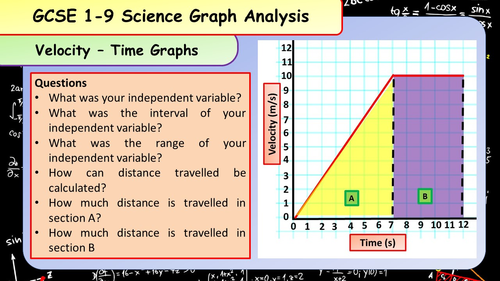
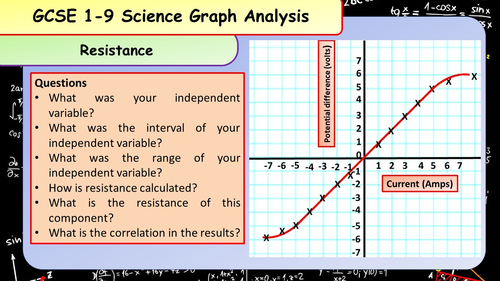
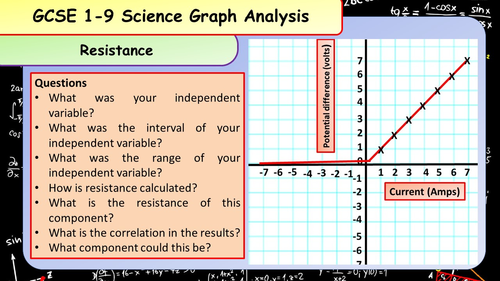
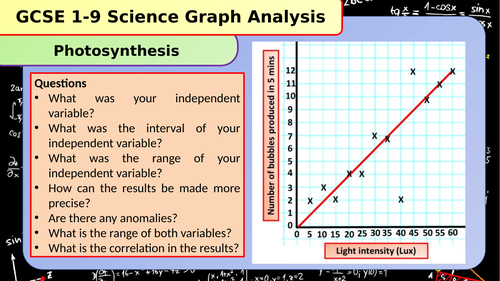
This resource is a set of 30 graph analysis questions that can be used to help students answer questions involving graphs in the Science GCSE. There are some graphs with questions to discuss with students, some with anomalies for students to identify and some which ask students to describe what the graph shows.
Thanks for looking
Something went wrong, please try again later.
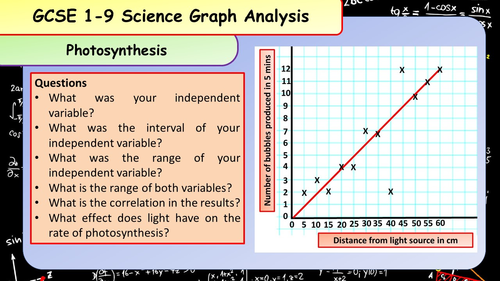
This was really useful as I needed lots of examples of graphs quickly. However, lots of mistakes; the two which spring to mind are the Photosynthesis graph which shows oxygen production increasing as the light source reduces, and NaOH referred to as an acid. Also some duplication of slides so not 30, but who's counting.
Report this resourceto let us know if it violates our terms and conditions.
Our customer service team will review your report and will be in touch.
£1.50