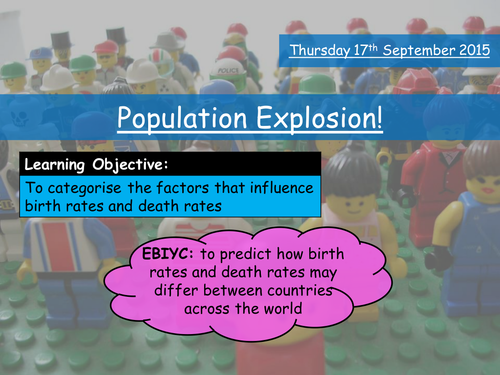

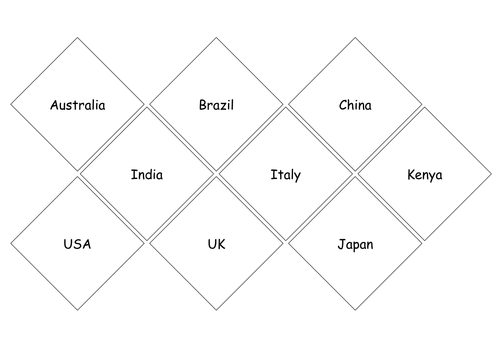
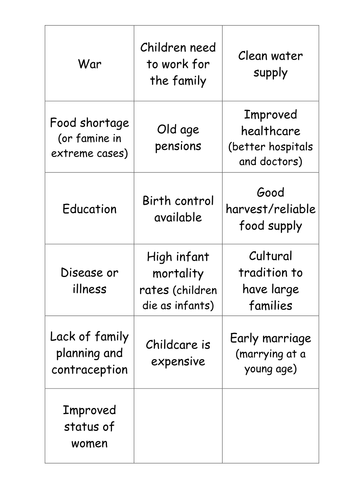
This lesson explores world population growth and the idea of a population explosion. It also covers the factors that affect a country's birth rate and death rate. This lesson includes a range of activities for different learning styles, including a continuum line, card sort, diamond 9 and drawing emojis to represent the different factors!
Used for high-ability Year 8, but am also going to be using these activities with Year 10 so could easily be adapted for other year groups and abilities.
Please rate my resources! Thank you :)
Used for high-ability Year 8, but am also going to be using these activities with Year 10 so could easily be adapted for other year groups and abilities.
Please rate my resources! Thank you :)
Something went wrong, please try again later.
A good resource. Thanks for sharing
I used it in my class. It was very engaging. And some students are always afraid of reading and drawing graphs. Kindly send easy way for the students to read graph and draw with explanation or examples of drawing and interpreting graphs.
Excellent resource and agree with hrcteach.
Really good resource, is a whole lesson ready to go (unlike a lot of other tes purchases!)
Report this resourceto let us know if it violates our terms and conditions.
Our customer service team will review your report and will be in touch.
£0.00