

A Powerpoint to explain Tally Charts, together with four pdf worksheets.
This powerpoint has 7 slides (Plus one title and one end slide). Designed for KS2. There are three fully animated Tally charts, which shows the tally marks being added as the items appear (each item appears as the teacher clicks the powerpoint forward, and a bar chart follows each one.
PDF Worksheets (all of which have a version with the answers filled in) are:
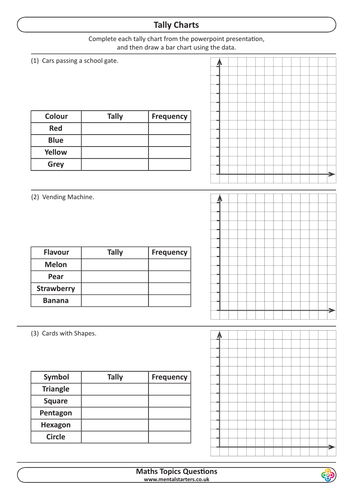
A one-sided A4 worksheet so pupils can fill in their own tally charts as the animations appear on screen in the powerpoint, and draw the bar charts themselves.
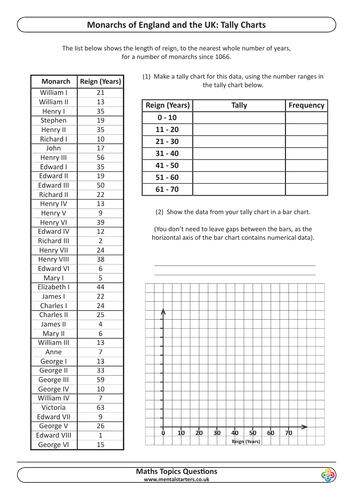
A one sided A4 worksheet entitled “Monarchs of England and the UK: Tally Charts” where data relating to the length of reign of a number of monarchs is give to the nearest year, and this can be used to fill in the tally chart and draw a bar chart.
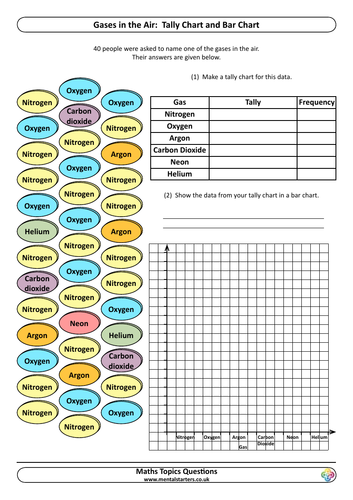
A one sided A4 worksheet entitled “Gases in the Air: Tally Chart and Bar Chart” . Here 40 people have given the name of one of the six gases in the air, and pupils make a tally chart of this data, and then draw a bar chart.
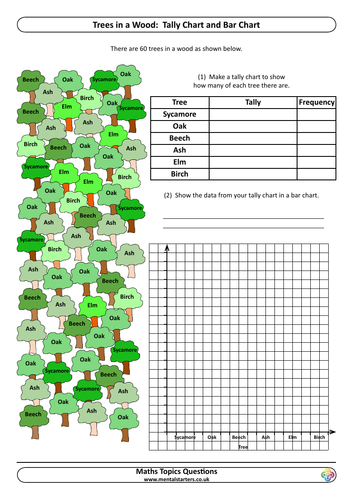
A one sided A4 worksheet entitled “Trees in a Wood: Tally Chart and Bar Chart” . Here 60 trees are given (6 different types), and pupils make a tally chart of this data, and then draw a bar chart.
I’ve also left the original powerpoint, which only has the tally charts.
Updated on 31st June 2018
Get this resource as part of a bundle and save up to 53%
A bundle is a package of resources grouped together to teach a particular topic, or a series of lessons, in one place.
Bundle
KS2 Data Bundle
This Bundle contains all 10 KS2 Statistics and Data Handling Powerpoints which I have available
£12.50
Bundle
Tally Chart & Bar Chart Bundle KS2
This contains both KS2 Maths Topics Tally Charts and Bar Charts powerpoints, plus all the worksheets attached to those products. The individual descriptions of each of the above are on the relevant page, but these two products complement eachother well, so are offered here as a bundle. Hope you like them. Also included as an extra is the 2-slide Line Graphs Powerpoint.
£3.75
Something went wrong, please try again later.
The PowerPoint has some of the most impressive animation I've seen on such a resource. I know this will fully engage my pupils. Thanks for the time you've taken to make this wonderful resource.
Report this resourceto let us know if it violates our terms and conditions.
Our customer service team will review your report and will be in touch.
£2.50