
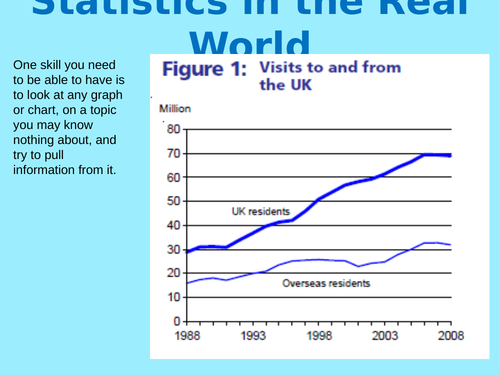


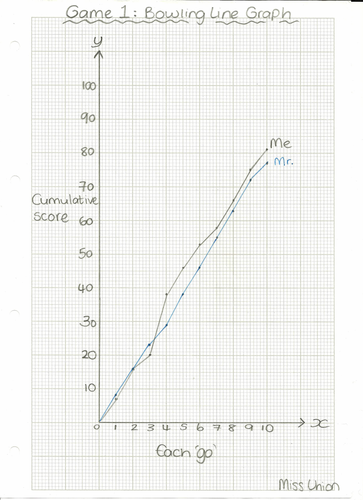


This full lesson has been used multiple times, including in observed lessons. Students enjoyed it and received very good feedback. It was supplemented by exam questions, which I have not included. It uses a real life example of bowling scores in order to draw line graphs. Can they draw a time series line graph? (There is an exemplar drawing for them to compare theirs to.) Can they predict trends? Can they look at any line graph and analyse them? Also includes a peer assessment grid. I’ve included a word document with a few bullet points on how to use the resources.
Something went wrong, please try again later.
This resource hasn't been reviewed yet
To ensure quality for our reviews, only customers who have purchased this resource can review it
Report this resourceto let us know if it violates our terms and conditions.
Our customer service team will review your report and will be in touch.
£3.00