
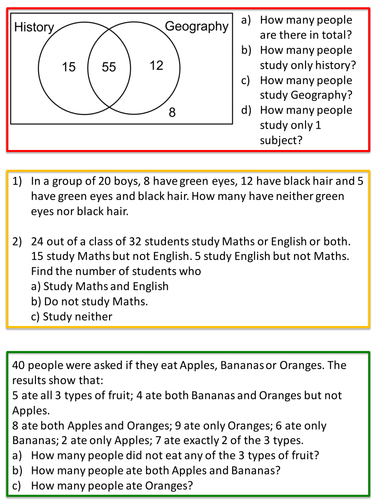
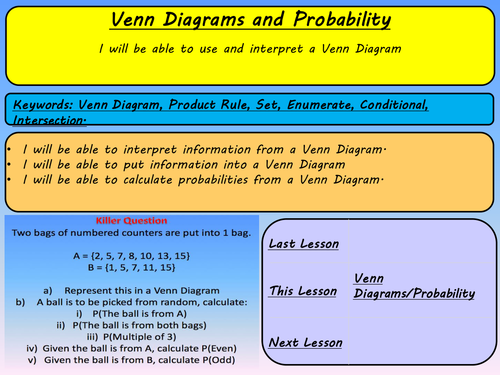
A series of lessons on Venn Diagrams which involve drawing information from a Venn Diagram, drawing venn diagrams and calculating probabilities from Venn Diagrams.
This lesson can be aimed at middle and high ability and all tasks are differentiated to at least 2 different levels.
All tasks have solutions and is ideal to use with a new curriculum topic.
Used with year 11 and pupils engaged and being challenged at all levels.
This lesson can be aimed at middle and high ability and all tasks are differentiated to at least 2 different levels.
All tasks have solutions and is ideal to use with a new curriculum topic.
Used with year 11 and pupils engaged and being challenged at all levels.
Something went wrong, please try again later.
This is an excellent, highly differentiated resource complete with solutions which has saved me hours of my time. It is the first one of Mr Brennan's Maths resources I have purchased and they are definitely great value for money. Please keep on producing these resources, I will be looking out for your name in the future. Fantastic opportunity to problem solve and reasoning in line with new curriculum.
Report this resourceto let us know if it violates our terms and conditions.
Our customer service team will review your report and will be in touch.
£3.00