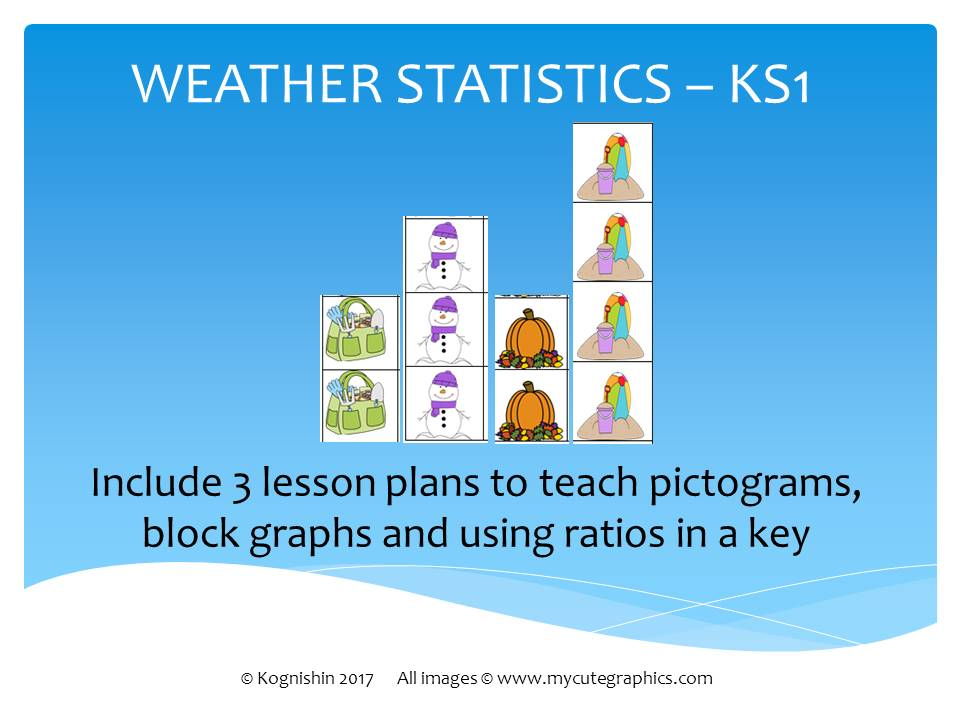
I used this resource to record seasonal data during a weather topic. It was very useful for the children to see the differences and similarities between pictograms and block graphs, For my more able children and children at expected levels (especially year 2) it was a successful way of practically introducing a key. Later in their own play I saw children using pictograms and block graphs - collecting data straight away on to the data method chosen, I had previously taught lessons on collecting data in tables but accuracy was affected as some children forgot or changed answers or repeat counted so this made it more about the data presentation and less about the time-consuming collection. Later we did a unit collecting data using tally’s which was much more accurate, once they could count in 5;s more accurately.
Something went wrong, please try again later.
This resource hasn't been reviewed yet
To ensure quality for our reviews, only customers who have purchased this resource can review it
Report this resourceto let us know if it violates our terms and conditions.
Our customer service team will review your report and will be in touch.
£2.00