
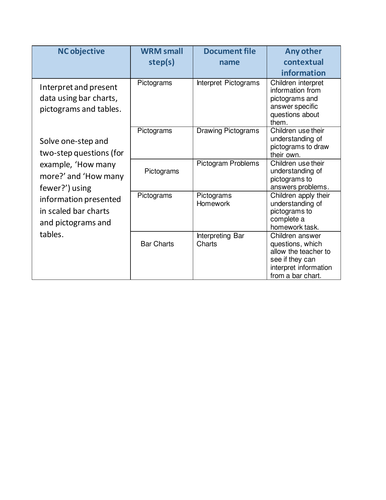
This is pack covers Year 3: Statistics: Pictograms and Bar Charts.
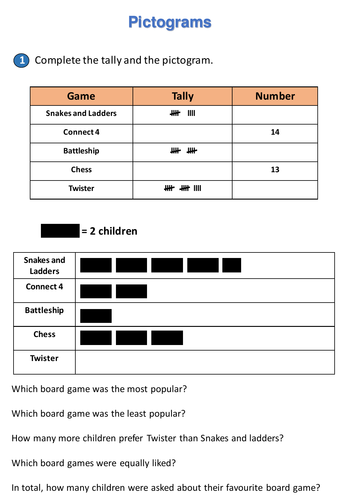
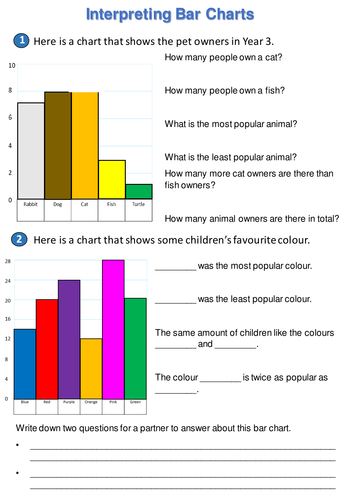
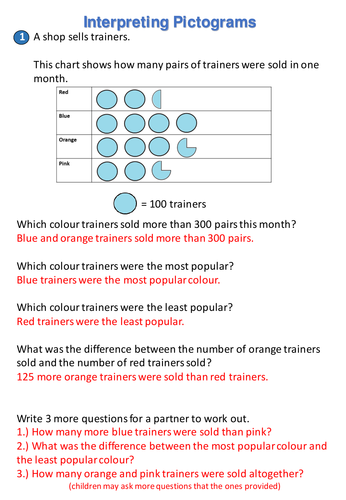
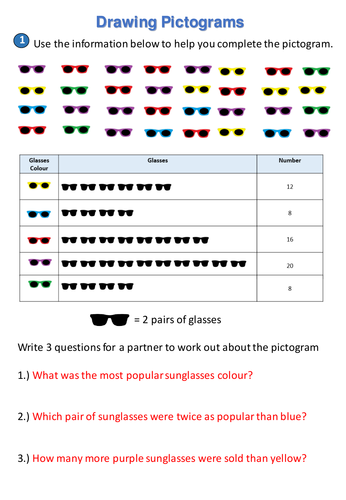
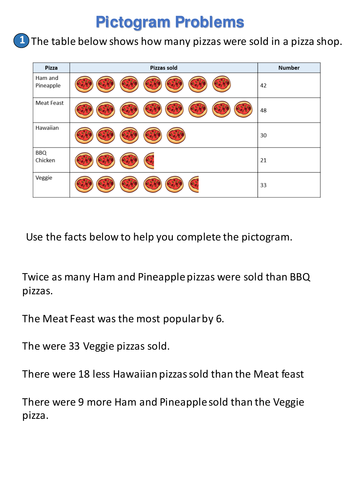
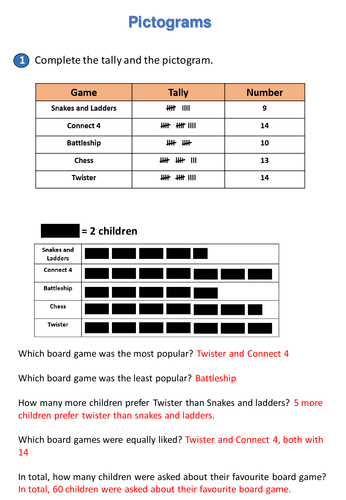
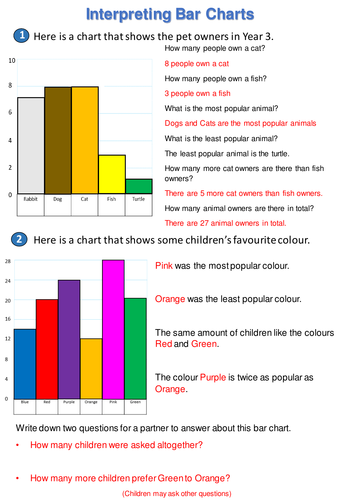
The resources aim to help children gain a deeper understanding of the concepts covered during the week. Children interpret and draw their own pictograms and begin to look at bar charts. There is also a homework task included!
The resources include as many pictorial and abstract representations as possible well as reasoning and problem solving activities and more open-ended problems to support and extend your whole class.
I hope you find them useful.
Get this resource as part of a bundle and save up to 40%
A bundle is a package of resources grouped together to teach a particular topic, or a series of lessons, in one place.
Something went wrong, please try again later.
This resource hasn't been reviewed yet
To ensure quality for our reviews, only customers who have purchased this resource can review it
Report this resourceto let us know if it violates our terms and conditions.
Our customer service team will review your report and will be in touch.
£5.00