Nasa video presentation. Find out how efficient data loggers, such as thermochrons and ingestible thermometers, collect repetitive data for NASA scientists to analyze. Learn about spinoff technologies that monitor body temperatures for athletes, firefighters and divers
a lesson that uses arduinos as data loggers for the light gate speed experiment a fun g and t activity or science club, all resources needed included, including text version of the code needed for the arduino, technicians notes for how to calibrate and lesson with worksheets. Arduinos plus LDR's are significantly cheaper than data loggers and more fun.
Activity outline to carry out an investigation to see which cup has the best insulation. Designed for Promethean board. Updated version
Flipchart viewer can be downloaded from the Promethean site
Please take the time to leave feedback.
a lesson that uses arduinos as data loggers for the cooling curves experiment a fun g and t activity or science club, all resources needed included, including text version of the code needed for the arduino, technicians notes for how to calibrate and lesson with worksheets. Arduinos plus thermistors are significantly cheaper than data loggers and more fun.
a lesson that uses arduinos as data loggers for the thermal radiation experiment a fun g and t activity or science club, all resources needed included, including text version of the code needed for the arduino, technicians notes for how to calibrate and lesson with worksheets. Arduinos plus thermistors are significantly cheaper than data loggers and more fun.
An activity for yr 3 to use data loggers to find out how dark shadows are. Pupils use the template to record their findings, before arranging from darkest to lightest. Aimed for use with Vu+ data loggers.
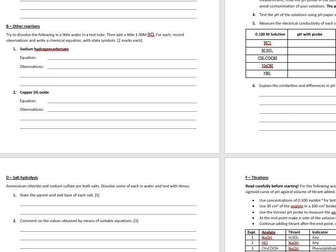
This laboratory activity can be used to test student knowledge after theory has been learnt, as an assessment. Alternatively, it could be used formatively to learn about acids and bases through experiment, and teach the theory in parallel. I have tried it both ways successfully with IB Chemistry HL classes. Groups of 2 or 3 are ideal and in total should take about 3-4 hours to do.
It has been designed to not be too wasteful and to make students think about what needs to be done in each part. For instance, in part A, students should work out that preparing a table for data collection in advance is a good idea. In part B students should be told to make a judgment on what is meant by “a little”. They should figure out that you only need enough to see what changes are occurring.
It is assumed that students already know the following, or it can be used to teach it to them:
Brønsted-Lowry theory
Acid-base reactions, including with metals
Conjugates of strong and weak acids
The pH scale
Ka and pKa (and therefore equilibrium and Le Chatelier’s principle)
Complex ions (acidity of aqua ions, for part B)
How to carry out a titration
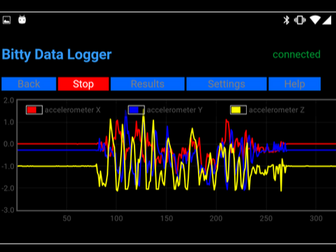
Need a quick and reliable motion data logger for speed/ distance practicals? Add a battery pack to your micro: bit and download the free bitty software.( www.bittysoftware.com ) This ‘how-to’ guide can work alongside the Bloodhound SSC Project, a global Engineering Adventure, using a 1,000mph World Land Speed Record attempt to inspire the next generation to enjoy, explore and get involved in science, technology, engineering and mathematics.
For more information on our inspiring workshops, activities, videos, and resources, visit www.bloodhoundssc.com, or follow us on twitter: @Bloodhound_EDU.
a bundle of lessons for common experiments, cooling curves, light gates and thermal radiation using an arduino as a data logger including codes (editable as text files) technicians notes for how to calibrate and powerpoints with student worksheets. Arduinos are fun and when you buy the components and the arduino also significantly cheaper than data loggers. Great for G and T kids or your science clubs.
I made this to accompany our NOVA data-logger in EKG mode but works with smartphone apps and other dataloggers.
Can be used as a starter or plenary of the ECG.
Comprises of flashcards and matching pairs games. The EKG data-logger DOES show the various waves, and model EGKs are also available.
Aimed at Upper sixth Biologists/ Sports scientists/ 1st year medics.
This is a two question worksheet that lets students practice propagating uncertainties in data tables and max/min gradients in graphs. It has guiding questions to help students calculate the uncertainty in the gradient and uncertainty in the intercept. The two questions involve raising a value to the power 3 and taking logs.
It includes the Logger Pro graphs for the answers.
This clear, detailed and visually-appealing resource offers a complete reference point for Year 4 children, teachers and parents covering knowledge relating to ‘Data and Information’ as a part of their computing learning.
The organiser has a particular focus on introducing children to data logging, including using data loggers to collect, log and interpret data. It contains comprehensive sections on:
-Overview;
-Data Collection;
-Data Recording;
-Analysing Data;
-Answering Questions;
-Key Vocabulary.
The content is fully aligned with the age-related expectations for Year 4 children in computing. The resource is designed to be printed onto A3, and is provided as both a PDF and a Word version (so that you can edit if you want to). All images used are licensed for commercial use and are cited on a separate document (included).
The fourth lesson in OCR specification module 3 section 3.1.1- measuring lung capacity.
It is a complete lesson covering objective e the use of spirometers to measure lung volume. It includes a starter, full notes, various student activities, a worksheet and a differentiated summary.
Includes work deigned to support the delivery of PAG10- investigation using data logger
All answers are provided. The answers to the worksheet are in the PowerPoint.
Some slides include extra information as to the delivery of content / activities and to support teaching
LO1: Can I investigate different insulators?
LO2: Can I measure temperature accurately using a thermometer?
Slides with lesson outline
comprehensive recording data sheet/investigation sheet
investigation slides
Data logger and line graphs slides
Used in Y5
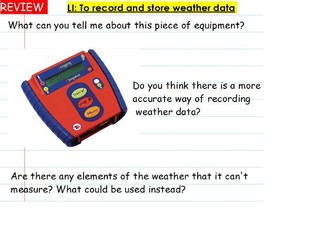
Activ flipchart (plus help sheets and resources) including up to 7 lessons. Originally planned for Y3. Lessons include recording weather data using data loggers and cameras, inputting data into Microsoft Excel, creating charts and graphs, creating and recording Power Point weather reports using the data and presenting the weather data collected through a Scratch animation.
This practical contains the technicians advice on how to complete it - even if it does require a little fudging! The students construct their own method to investigate the effect of lipids on bile.
This does not necessarily require a data logger rand phenolpthalein indicator can be used instead to give an excellent pink colour.
Short video showing the GCSE required practical investigating the relationship between force, mass and acceleration.
We have chosen a method using data loggers to carry out this practical. If carried out carefully this experiment yields good results although the presence of friction is problematic.