A ready-to-use World Cup 2026 maths activity using team line-ups and player age data.
Includes:
REAL Visual team line-up sheets
REAL Player age data
Mean, median, mode and range questions
Team comparison activities
Football-themed reasoning challenges
Perfect for KS2, lower KS3, statistics lessons and end-of-term maths
Turn World Cup fever into high-impact learning with a ready-to-print mathematical data pack! Save hours of writing math problems with a beautifully formatted 5-page workbook pack (.pdf) that uses real-world tournament statistics to drill vital math concepts. Perfectly tailored for Key Stage 2 and Key Stage 3 (Ages 9-14) classrooms, early morning work, or end-of-term activities.
What’s Packed Inside the Data Set:
The Master Data Bank: Clean, engaging statistical tables tracking team FIFA ranks, historical goal counts, squad sizes, and player goal-efficiency ratios.
Task 1 (Statistics): Differentiated challenges tracking the Mean, Median, Mode, and Range of qualifying groups.
Task 2 (Time Zones): Real-world clock arithmetic and multi-step time calculation word problems spanning London, New York, Vancouver, and Mexico City.
Task 3 (Geometry & Coordinates): Strategic straight-line vector translations and coordinate pitch-plotting on a tactical grid matrix.
Task 4 (Fractions & Percentages): Calculations covering stadium capacity percentages, goal conversion metrics, and ratio reductions.
Why Teachers Love This Resource:
Built-in Teacher Answer Key: Includes a complete, step-by-step master mark scheme for immediate grading or quick student peer-assessment.
Zero Planning Required: Crisp typography and beautifully spaced formatting ensure it prints flawlessly straight out of the box.
Cross-Curricular Value: Blends core mathematical curriculum criteria with active student passion for sports and geography.
Download this premium pack today and get your students excited about data analytics and statistics!
Search Tags
World Cup maths worksheets, data handling statistics, time zones word problems, coordinate grid vectors, mean median mode range, fractions percentages math, key stage 2 end of term, sports mathematics.
Resources include a relevant starter, an explanation of the difference between qualitative, quantitative, discrete and continuous data and a card sort activity.
Posters for data handling working wall display. These posters cover all area of the information handling topic for KS2/2nd level, including line graphs, pictographs, bar charts, pie charts and explaining data handling.
The display is visual, and uses dyslexia-friendly fonts.
Harness World Cup 2026 Fever for Maximum Classroom Engagement!
Keep your students focused and motivated during the end-of-term excitement! Maths in Motion: World Cup 2026 Data-Handling & Numeracy Workbook channels enthusiasm for the world’s biggest sporting event into concrete, high-impact math skills.
Using real 48-team tournament data, geographic time zones, and historical statistics, this zero-prep, print-and-go resource brings abstract concepts to life.
Resource Highlights
Target Levels: Primary (KS2) & Lower Secondary (KS3)
Curriculum Focus: Statistics, Geometry, Position, Ratio, and Probability
Setup Time: Zero Prep – Print and Deploy
What’s Included in the Workbook?
This comprehensive pack features 4 progressive, tiered tasks complete with dedicated marks for easy assessment:
Task 1: Plotting the Host Stadium Grid – Grid reading, coordinate plotting, and vector shifts using North American host cities.
Task 2: Historical Tournament Stat Analyses – Calculating the Mean, Median, Mode, and Range of real FIFA scoring data, plus a 2026 expansion predictive challenge.
Task 3: Time-Zone Matrix Calculations – Functional numeracy and multi-step time-difference problem solving (GMT vs. US/Mexico time zones).
Task 4: Bracket Probability & Logic Models – Fraction, decimal, and percentage practice using tournament progress trees and stadium attendance ratios.
Built-In Differentiation
Every task contains tiered tracks clearly marked by difficulty, making it perfect for mixed-ability classrooms:
Core Level (KS2 / Lower Track): Basic coordinates, standard averages, positive time differences, and simple fraction probabilities.
Extended Level (KS3 / Higher Track): Vectors, negative integer timelines, and compound probability reasoning.
Save hours of planning and deliver a high-interest, curriculum-aligned math lesson. Download the Maths_in_Motion_World_Cup_Worksheets.pdf pack today!
New online service NOW AVAILABLE where this resource is available for less Data Handling ‘Traffic Survey’ Activity OR for FREE downloads (including this resource) sign up at… Alphabet Learning
What’s included?
This download includes x2 A4, portrait, pdf sheets.
Who’s it for?
This resource has been designed for early years children, pupils in years one and two as well as older students needing additional learning support.
What’s it for?
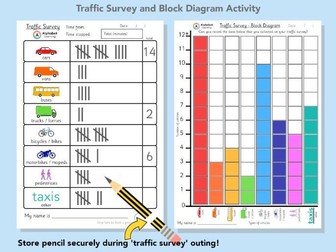
This is a meaningful, hands-on activity for data handling. It helps children count and record different traffic types (up to seven), and teaches them to organise this data into a block diagram. An empty space is included allowing you to customise the traffic items.
Resource Details
There are x2 stages to this activity, going out (always with an adult!) to count vehicles for an agreed amount of time and transferring the information collected onto a block diagram.
Page 1
Learners will practice counting different types of vehicles and pedestrians they observe from a safe distance (always with adult supervision!) The record sheet includes:
cars
vans
buses
trucks
bicycles
motorbikes
pedestrians
plus an extra space to add another type of traffic/vehicle
Page 2
Use the information from your “traffic survey” to complete this simple, clear block diagram. Simply colour the correct number of boxes for each type of vehicle. For any group with more than x12 vehicles, colour up to the “12+” line to show a large number.
Important message
Any issues with this resource please let us know - we are happy to make changes.
REMEMBER…
New online service NOW AVAILABLE with FREE downloads (including this resource!) Sign up for instant free credits to use at… Alphabet Learning
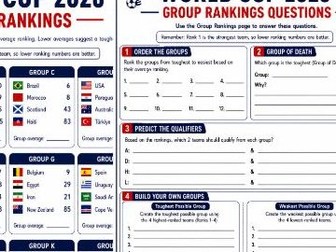
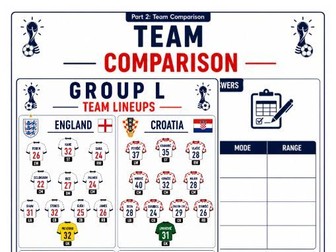
A fun ranking and reasoning activity where pupils use the Real Rankings of each World Cup team in Each Group and work out the Average for each group.
Also comes with follow up questions to compare teams and groups with extra reasoning questions and opens up to debate amongst students.
Includes:
All World Cup 2026 groups
Real up to date Team ranking information
Group comparison tasks
Reasoning and justification questions
Discussion and debate opportunities
Great for tutor time, geography links, themed weeks and display work
This is a lesson looking at how and when to draw different graphs, identifying variables and analysing a graph or data and planning an experiment. There are three different worksheets at the beginning to go with the PowerPoint, one for low ability, one for intermediate and one for high ability students to be printed off before the lesson.
OCR AAQ Applied Science F181 Science in Society: Topic Area 2 Handling scientific data
For previous FREE sample work see here:
https://www.tes.com/teaching-resource/resource-13481144
The following FREE bundle contains PowerPoints for the whole topic. All PowerPoints are fully aligned with the specification and OCR’s F181 Scheme of Work. Exam questions are also included (with mark scheme).
PowerPoints:
2.1 Types of scientific data
2.2 Collecting scientific data
2.3.1 How Scientific data can be stored on databases
2.3.2 Scientific data can be represented in different graphical forms
2.4 Interpreting data
.
All PowerPoints are designed for a typical 1 hour lesson and include:
.
Title slide
Specification points
Starter activity
Main ideas from the specification
Summary table of advantages and disadvantages
Exam questions
Lesson summary and recall
Homework and further resources (with embedded links)
_
All ANSWERS to questions and INFO can be found in the “notes” section of the PowerPoint
Course: OCR Level 3 Alternative Academic Qualification Cambridge Advanced Nationals in Applied Science.
Unit F181: Science in society
Topic Area 2: Handling scientific data
2.1 Types of scientific data
2.2 Collecting scientific data
2.3 Storage and presentation of scientific data
2.4 Interpreting data
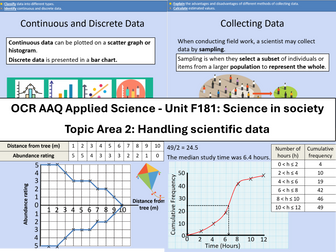
Qualitative and quantitative data
Continuous and discrete data
Data from observations and
measurements
Primary and secondary data
Observation and measurement
from experiments
Surveys
Sampling
Random
Systematic
Estimation
Cohort studies
Meta-studies
Computer modelling
Personal database
National database
International database
Scatter and line graph
Bar chart
Histogram
Pie chart
Kite diagram
Cumulative graph
Box and whisker plots
Draw conclusions
Accept or reject a hypothesis
Inform further scientific
investigation
Mathematical skills include:
Calculate the mean, median, mode, range (e.g. height of group of organisms, number of stomata in a plant).
Determining the intercept and/or gradient using y = mx + c.
Calculating the rate of change from a graph with a linear relationship (e.g. rate of transpiration).
Drawing a tangent to a curve on a graph to calculate the rate of change (e.g. amount of product produced against time, at a fixed concentration of enzyme).
Calculate the standard deviation of a set of data.
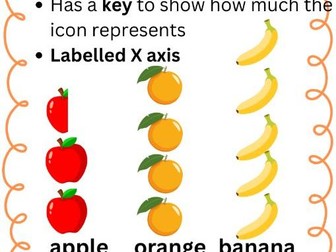
This resource includes tally charts to be completed, making pictograms and interpreting data from pictograms and tables, involving counting in 1, 2s, 5s and 10s. These activities will supplement maths schemes and focus on the objectives of the year 2 maths curriculum - statistics.
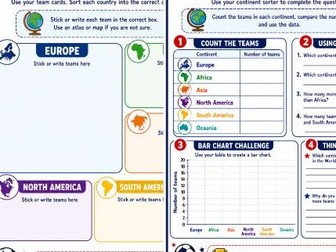
A geography and data-handling activity based on all 48 World Cup 2026 teams.
Includes:
Continent sorting activity
All 48 qualified teams
Data collection task
Bar chart challenge
Questions based on the completed data
Combines maths, geography and World Cup excitement
Perfect for KS2, lower KS3, statistics lessons and themed project work
Two Data Handling lessons.
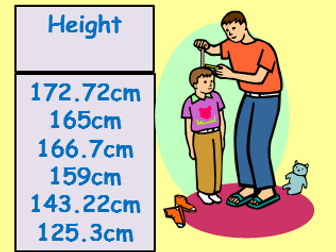
Outdoor, human bar chart activity.
Throughout the lesson, pupils create a checklist for a successful bar chart (x and y axis, bars, categories, numbers/scale etc)
Cross curricular main activity (Harry Potter Theme - English) - pupils are sent a letter from Hermione complaining about her imbalance of Bertie Bott's every flavour beans!
Practical activity whereby children collect their own data to create bar chart. I gave children jelly beans (cheap ones and printed off a posh label!) and required them to count them.
Magic beans used as a reward for hard workers!
Lesson plan, letter from Hermione and Harry Potter story extract, successful bar chart checklist, colour of beans table all included.
Formative assessment (Starter/Plenary) - Children add to what they have learned in different coloured pen on spider diagram.
I used this lesson with years 3, 4 and 5 - can be differentiated for all . They LOVED it.
Lesson 2 - children created 3D Bar Charts.
Designed for upper KS2 this activity will enable pupils to understand the purpose of collecting and analysing data. It is differentiated 3 ways with support for the less able and challenges for the more able. It also comes with ideas for further activities which could be used to form the basis of a mini project, ideal for the end of term.
 Quick View