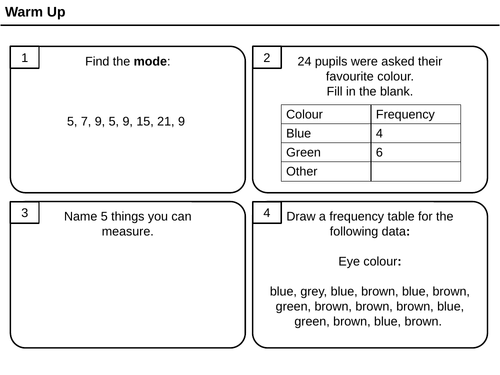

Covers how to draw a frequency table, continuous and discrete data and finding the mode from grouped and ungrouped frequency tables.
Has a starter, some example problem pairs, some questions (that aren’t amazing tbh) and a plenary.
Something went wrong, please try again later.
nice material for introducing frequency tables
Report this resourceto let us know if it violates our terms and conditions.
Our customer service team will review your report and will be in touch.
£0.00