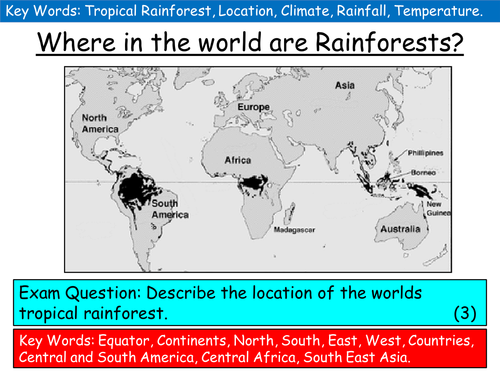
Students to write down the key idea and watch a short video on the climate in the rainforest. Students are to describe what a climate graph is using no more than 25 words, this can be done on a mini white board and are then to answer key questions about the graph by reading the data it presents. Students are to then create their own climate graph using the data presented. Extension question: Explain the climate of a Tropical Rainforest using your climate graph. To end students can compare the climate in Brazil to the climate of the UK.
Something went wrong, please try again later.
This resource hasn't been reviewed yet
To ensure quality for our reviews, only customers who have purchased this resource can review it
Report this resourceto let us know if it violates our terms and conditions.
Our customer service team will review your report and will be in touch.
£2.50
