
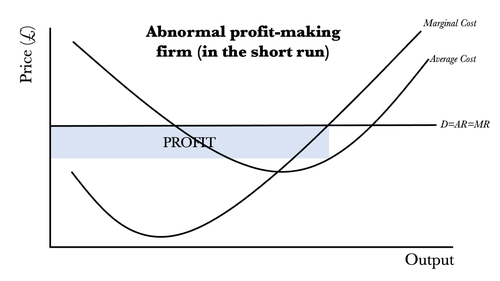
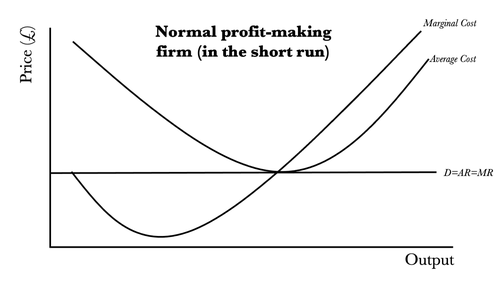
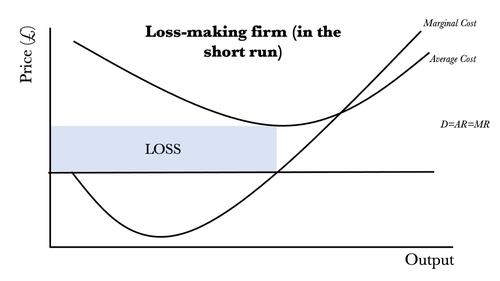
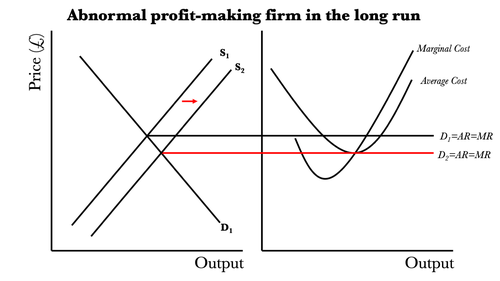

Sixteen high-quality Cost and Revenues graphs for A-Level economics. Brilliant visual teaching aid.
Clearly colour-coded and labelled.
PNGs and PowerPoints included.
Includes:
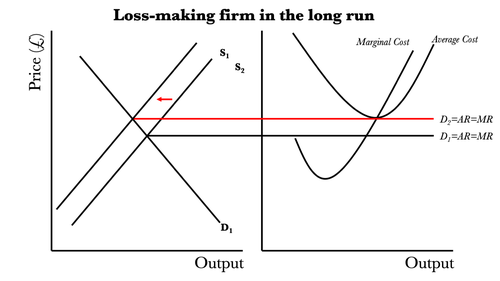
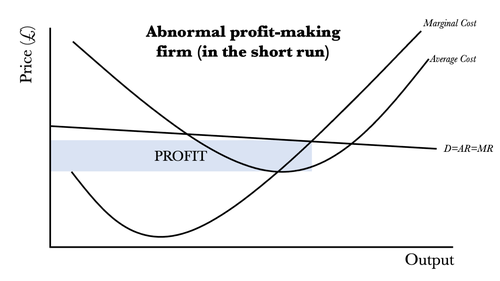
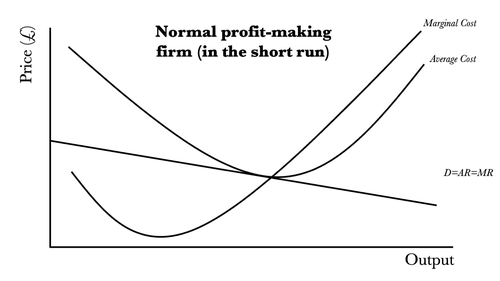
- Long- and short-run perfect competition graphs
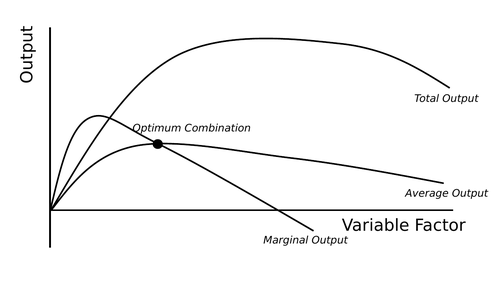
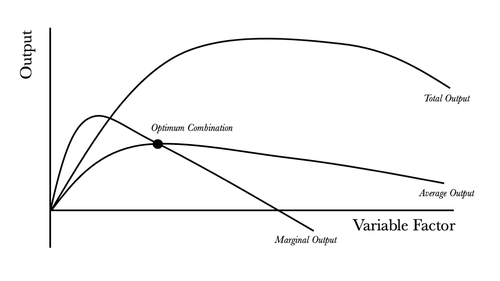
- Diminishing marginal returns graph
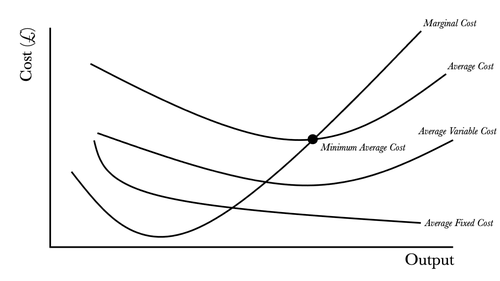
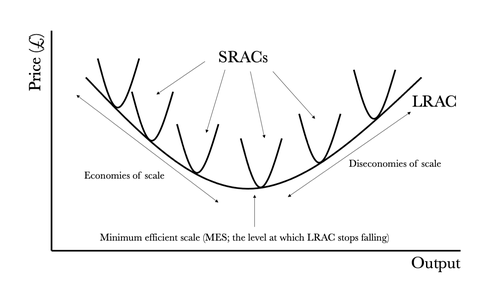
- Long-run average cost curve (labelled and illustrated with short-run curves)
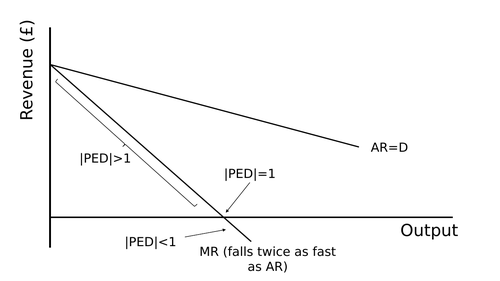
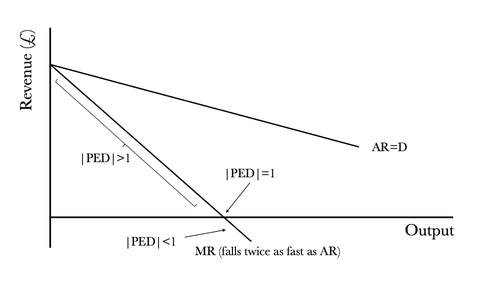
- Price elasticity illustrations of the AR curve
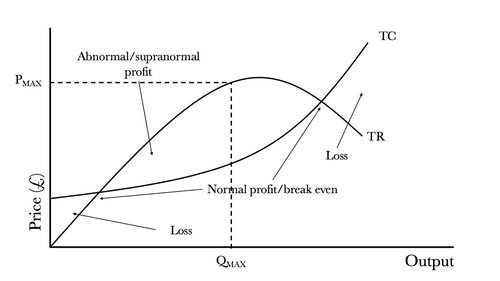
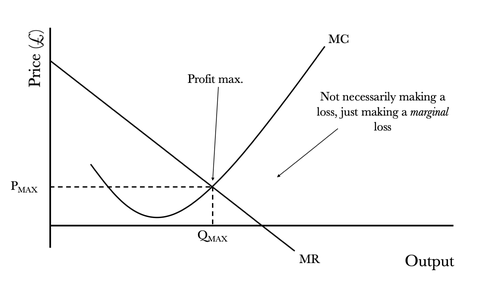
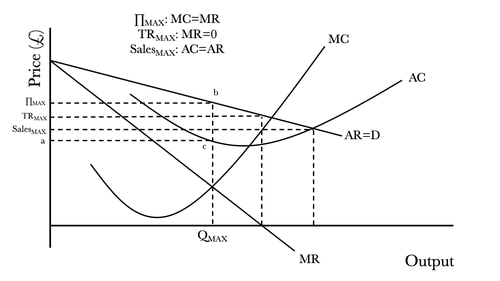
- Imperfect competition graph, fully-labelled with dynamic and allocative efficiency
Something went wrong, please try again later.
This resource hasn't been reviewed yet
To ensure quality for our reviews, only customers who have purchased this resource can review it
Report this resourceto let us know if it violates our terms and conditions.
Our customer service team will review your report and will be in touch.
£1.00