


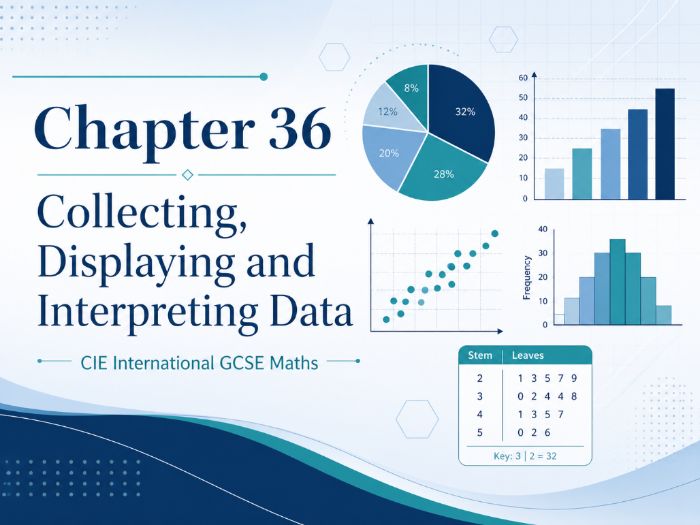
Designed for CIE International GCSE Maths, this full resource bundle supports the chapter on collecting, displaying and interpreting data, including frequency tables, pictograms, stem-and-leaf diagrams, pie charts, surveys, scatter diagrams, correlation and histograms with frequency density. It is based on the uploaded chapter content.
The student resources provide clear notes, worked methods, progressive practice, challenge tasks and a mini assessment. The teacher resources include a lesson plan, teaching notes and a classroom-ready slide deck with examples, guided practice, hinge questions, misconceptions and plenary activities.
WHAT IS INCLUDED
student_notes.pdf — full student notes with explanations, vocabulary, examples, common mistakes and quick checks.
worked_examples.pdf — step-by-step worked examples for the main data-display methods.
practice_questions.pdf — progressive practice questions covering tables, charts, scatter diagrams and histograms.
challenge_questions.pdf — harder questions involving comparison, interpretation and correcting misconceptions.
mini_assessment.pdf — short exam-style assessment for the chapter.
mark_scheme.pdf — full answers, methods, mark allocations and common errors.
lesson_plan.pdf — structured teaching sequence with starter, main activities, differentiation and plenary.
presentation_slides.pdf — 34-slide classroom-ready Beamer lesson deck.
teaching_notes.pdf — teacher guidance, questioning prompts, interventions and differentiation notes.
Get this resource as part of a bundle and save up to 50%
A bundle is a package of resources grouped together to teach a particular topic, or a series of lessons, in one place.
Something went wrong, please try again later.
This resource hasn't been reviewed yet
To ensure quality for our reviews, only customers who have purchased this resource can review it
Report this resourceto let us know if it violates our terms and conditions.
Our customer service team will review your report and will be in touch.
£4.49