

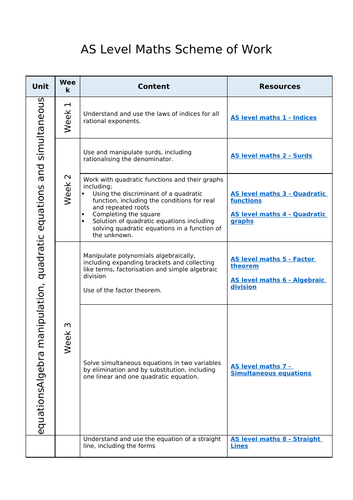
These PowerPoints form full lessons of work that together cover the new A level Maths course for all exam boards. Together all the PowerPoints include;
• A complete set of notes for students
• Model examples
• Probing questions to test understanding
• Class questions including answers
• Individual whiteboard work
• Links to exercises in ‘The Textbook by CGP’ these can easily be edited for your textbook
The PowerPoints can be used in the lesson and also given to students that have missed a lesson
Sampling, data representation, averages and spread covers;
- Understand and use the terms ‘population’ and ‘sample’
- Use samples to make informal inferences about the population
- Understand and use sampling techniques, including simple random sampling and opportunity sampling
- Select or critique sampling techniques in the context of solving a statistical problem, including understanding that different samples can lead to different conclusions about the population.
- Interpret diagrams for single-variable data, including understanding that area in a histogram represents frequency
- Connect to probability distributions
- Interpret measures of central tendency and variation, extending to standard deviation
- Be able to calculate standard deviation, including from summary statistics
Get this resource as part of a bundle and save up to 24%
A bundle is a package of resources grouped together to teach a particular topic, or a series of lessons, in one place.
Something went wrong, please try again later.
This resource hasn't been reviewed yet
To ensure quality for our reviews, only customers who have purchased this resource can review it
Report this resourceto let us know if it violates our terms and conditions.
Our customer service team will review your report and will be in touch.
£6.00