
The presentation tackles complex data analysis with step-by-step approach focusing on the practical application of 3-Circle Venn Diagrams.
It is also resource is designed to guide students through advanced problem-solving by teaching them how to:
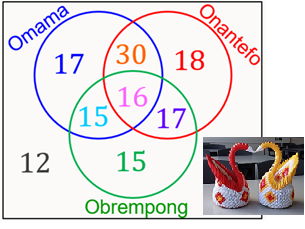
Organize real-life information into the intricate structure of a 3-circle diagram.
Pull specific information based on sophisticated criteria involving Union, Intersection, and Complements shading in all the 8 Regions.
Apply critical thinking to engaging, scenario-based application questions
Cross-reference visual diagram solutions with formal mathematical equations, bridging the gap between diagrammatic representation and algebraic problem-solving.
This presentation provides a complete framework for mastering advanced data analysis and probability in a real-world context.
Get this resource as part of a bundle and save up to 42%
A bundle is a package of resources grouped together to teach a particular topic, or a series of lessons, in one place.
Something went wrong, please try again later.
This resource hasn't been reviewed yet
To ensure quality for our reviews, only customers who have purchased this resource can review it
Report this resourceto let us know if it violates our terms and conditions.
Our customer service team will review your report and will be in touch.
£6.00