


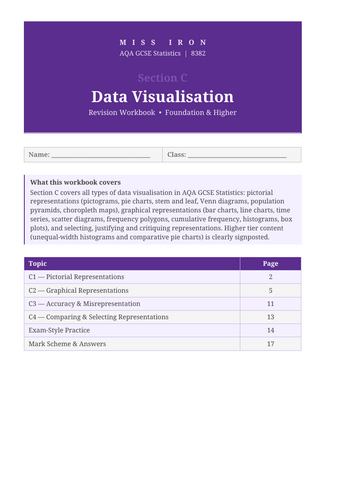
A revision workbook covering Section C of the AQA GCSE Statistics specification (8382). Covers all data visualisation topics for Foundation and Higher tier, with Higher-only content clearly signposted.
Topics covered:
Pictograms, pie charts, stem and leaf, Venn diagrams
Population pyramids and choropleth maps
Comparative pie charts and radius formula (Higher)
Bar charts (simple, dual, composite, percentage)
Time series and 4-point moving averages
Scatter diagrams, double mean point, interpolation vs extrapolation
Frequency polygons and cumulative frequency diagrams
Box plots and quartile calculations
Histograms — equal and unequal class widths with frequency density (Higher)
Graphical misrepresentation — truncated axes, unequal scales, frequency density errors
Selecting and justifying the right chart for a given dataset
Includes worked examples, common mistake boxes based on 2024 AQA examiner reports, exam-style practice questions, and a full mark scheme. Compatible with the 2019–onwards specification.
Get this resource as part of a bundle and save up to 26%
A bundle is a package of resources grouped together to teach a particular topic, or a series of lessons, in one place.
Something went wrong, please try again later.
This resource hasn't been reviewed yet
To ensure quality for our reviews, only customers who have purchased this resource can review it
Report this resourceto let us know if it violates our terms and conditions.
Our customer service team will review your report and will be in touch.
£1.89