


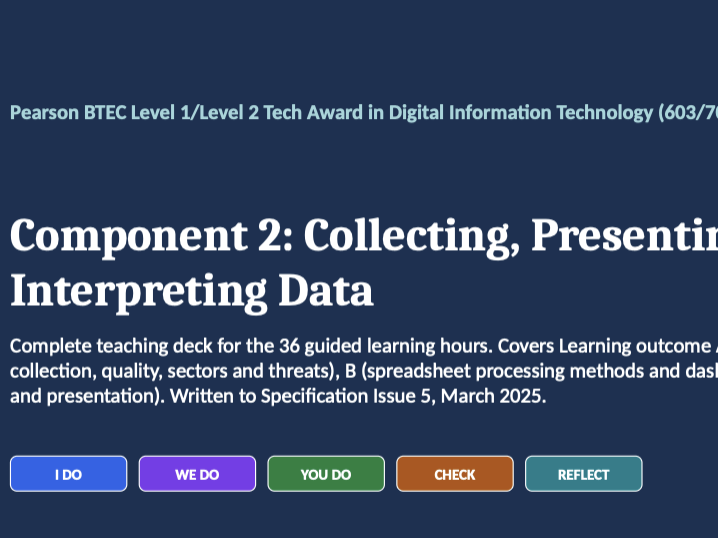
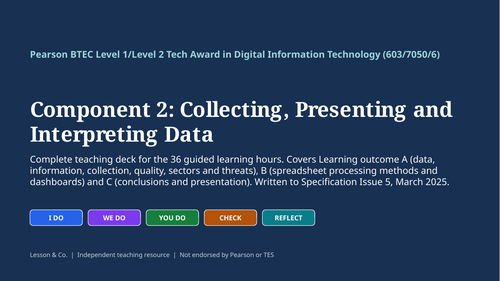
BTEC Tech Award Digital Information Technology – Component 2: Collecting, Presenting and Interpreting Data | Complete 87-Slide Teaching Deck
Teach all of Component 2 with one fully editable PowerPoint deck, written for the Pearson BTEC Level 1/Level 2 Tech Award in Digital Information Technology (603/7050/6). It covers Learning Aims A, B and C, from collecting data to building and evaluating a dashboard.
WHAT’S INCLUDED
87 slides in 10 sections, with speaker notes on every slide
15 learning-objective slides, so each lesson starts with clear goals
A clear I DO → WE DO → YOU DO → CHECK → REFLECT sequence throughout
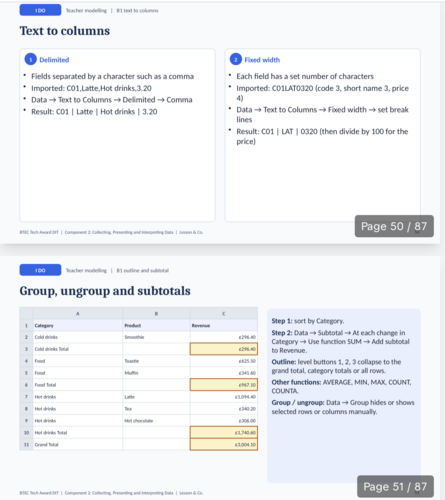
8 spreadsheet views with a working formula bar and highlighted cells, showing exactly what students type and where
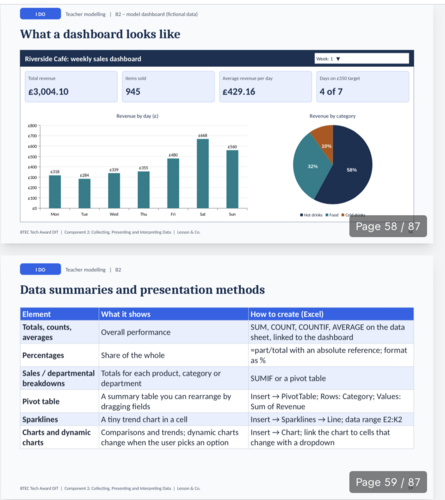
A dashboard mock-up made with native, editable PowerPoint charts, with KPIs, a bar chart and a pie chart
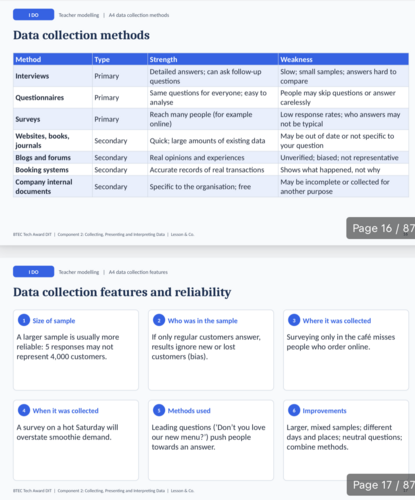
18 teaching tables, 11 concept-card slides, 6 case-study slides and 2 bar charts
7 YOU DO tasks for independent practice
4 retrieval quizzes (24 questions in total), with answers in the notes
A card-sort activity and a model-response slide that shows what a strong written evaluation looks like
ONE DATASET, START TO FINISH
Students work with one fictional business, Riverside Café, for the whole component. A week of sales across six products builds up step by step: SUM, AVERAGE, MAX, MIN, COUNTIF, SUMIF, IF, lookups, absolute and relative referencing, what-if analysis, goal seek, filters, subtotals, conditional formatting and macros. Every figure on every slide was checked by calculation, so the totals, averages and percentages students work out will match the slides.
COVERAGE
A: The ways data is used, what makes data good quality, the factors affecting how it is collected, and presenting it accurately.
B: Spreadsheet skills to process and analyse data, then building a dashboard.
C: Drawing conclusions, making recommendations and evaluating how well a dashboard meets a client’s needs.
Final section: assignment-style skills, such as planning written evaluations, using evidence and avoiding common pitfalls.
PRACTICAL NOTES FOR TEACHERS
The notes explain where Excel and Google Sheets differ
What-if analysis is taught as a set of tools (scenarios, goal seek, data tables), not as a single function
The notes remind students that macro workbooks must be saved as .xlsm
The spreadsheet views are illustrations on slides. Students should rebuild them in real software, using the figures shown.
Ready to teach and fully editable. Ideal for non-specialists, cover and revision.
Independent resource from Lesson & Co. Not endorsed by or affiliated with Pearson. All organisations, people and data are fictional. Always check the current specification and assessment guidance on the Pearson website.
Something went wrong, please try again later.
This resource hasn't been reviewed yet
To ensure quality for our reviews, only customers who have purchased this resource can review it
Report this resourceto let us know if it violates our terms and conditions.
Our customer service team will review your report and will be in touch.
£11.99