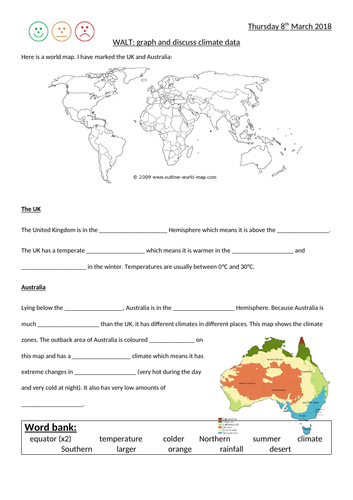

Lesson to introduce climate and climate zones including plotting and interpreting climate graphs. Uses climate data for Warburton, Australia and Sheffield, UK but could be altered. Used with Y6.
Something went wrong, please try again later.
I paid for this and it downloaded it in flipchart and I have no way of converting. I can't change it either which is now a waste of time and money.
Report this resourceto let us know if it violates our terms and conditions.
Our customer service team will review your report and will be in touch.
£3.00
