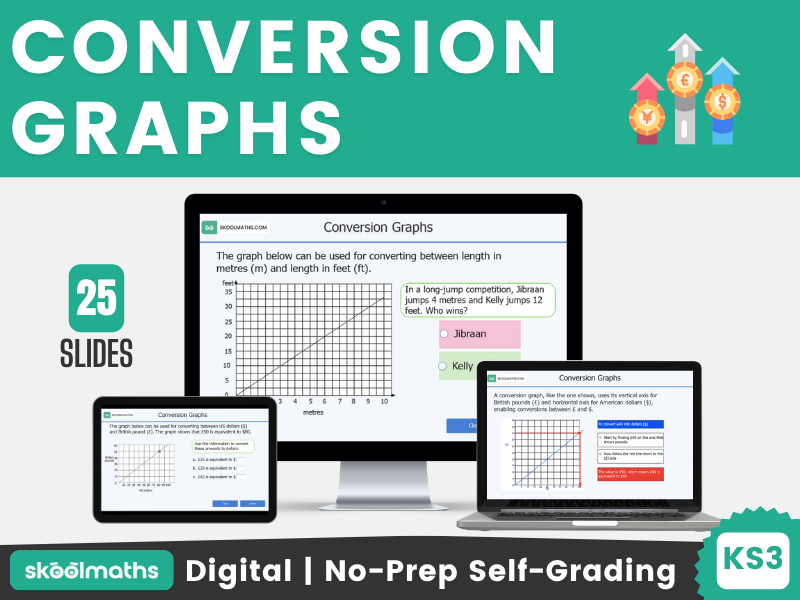
**Conversion Graphs - Interactive Digital Maths Lesson with Self-Marking Activities for Year 7**
This is a Key Stage 3 Maths Lesson for Year 7 on conversion graphs. In this lesson, learners will be able to plot and interpret graphs from real life data. They will also be able to calculate currency exchange using conversion graphs.
Lesson can be used as whole class teaching by teachers and at home by learners.
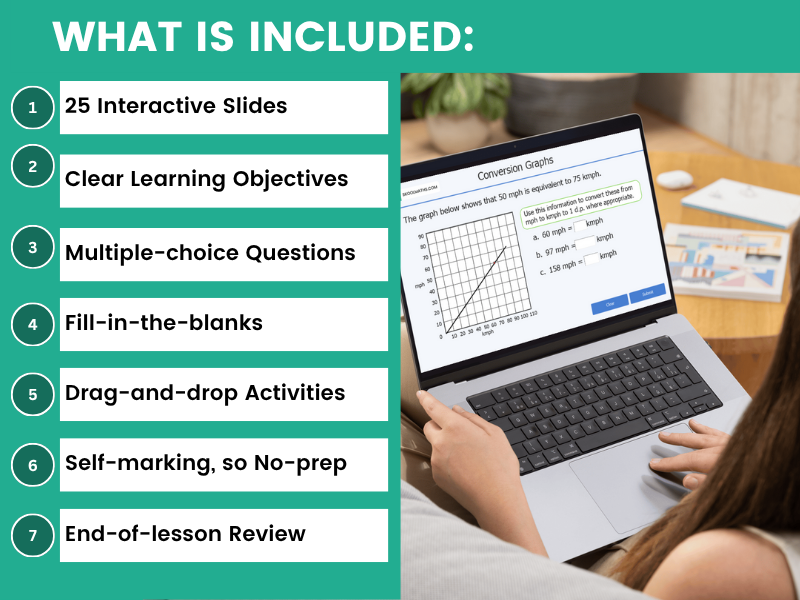
Lots of drag and drop activities with instant feedback.
This is a Key Stage 3 Maths Lesson for Year 7 on conversion graphs. In this lesson, learners will be able to plot and interpret graphs from real life data. They will also be able to calculate currency exchange using conversion graphs.
Lesson can be used as whole class teaching by teachers and at home by learners.
Lots of drag and drop activities with instant feedback.
Get this resource as part of a bundle and save up to 19%
A bundle is a package of resources grouped together to teach a particular topic, or a series of lessons, in one place.
Something went wrong, please try again later.
This resource hasn't been reviewed yet
To ensure quality for our reviews, only customers who have purchased this resource can review it
Report this resourceto let us know if it violates our terms and conditions.
Our customer service team will review your report and will be in touch.
£3.58