

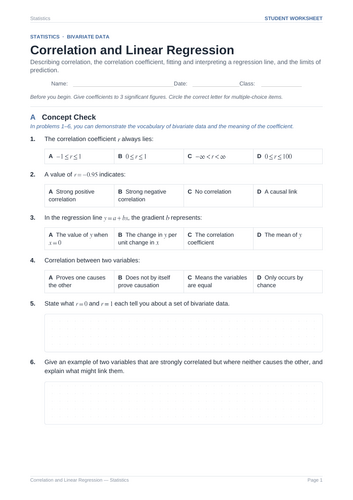

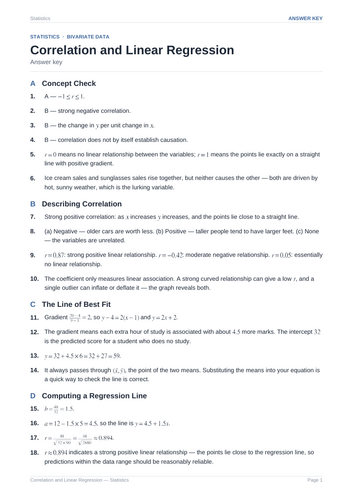
Master bivariate data analysis with this Statistics worksheet! Covers describing scatter graph correlation, interpreting Pearson’s correlation coefficient, fitting and evaluating least-squares regression lines, predicting values via interpolation vs. extrapolation, understanding correlation vs. causation, and answer key.
This comprehensive 5-page student worksheet is designed to help students master bivariate data interpretation and linear modeling techniques. It guides learners step-by-step from core definitions of correlation and regression parameters to calculating summary statistics, evaluating prediction limits, and analyzing real-world lurking variables.
What is Included:
Section A: Concept Check: Evaluates foundational understanding of Pearson’s correlation coefficient range, interpreting gradients in regression equations, and distinguishing correlation from causation.
Section B: Describing Correlation: Focuses on analyzing scatter graphs to identify positive, negative, and zero correlation, as well as evaluating linear vs. non-linear patterns.
Section C: Fitting a Regression Line: Guides students through determining the line of best fit, calculating y-intercepts and gradients, and interpreting model parameters in context.
Section D: The Correlation Coefficient: Covers calculating and interpreting the Pearson correlation coefficient r from summary statistics, and judging the strength of linear relationships.
Section E: Prediction and Its Limits: Focuses on using regression equations to make predictions, evaluating the reliability of interpolation versus extrapolation, and analyzing the impact of outliers.
Section F: Applications and Challenge: Features full bivariate data analysis problems, constructing regression lines from summary values, and exploring classic third-variable (lurking variable) scenarios.
Teacher Benefits:
Ready to Print & Go: Zero prep required. Excellent for structured classroom instruction, targeted homework assignments, independent practice, sub plans, or unit assessment preparation.
Complete Solutions Included: Comes with a fully worked answer key detailing conceptual checks, exact decimal evaluations, step-by-step regression derivations, and contextual explanations.
Scaffolded & Comprehensive: Progresses logically from qualitative scatter plot description to quantitative regression fitting, prediction analysis, and critical statistical reasoning.
Something went wrong, please try again later.
This resource hasn't been reviewed yet
To ensure quality for our reviews, only customers who have purchased this resource can review it
Report this resourceto let us know if it violates our terms and conditions.
Our customer service team will review your report and will be in touch.
£4.00