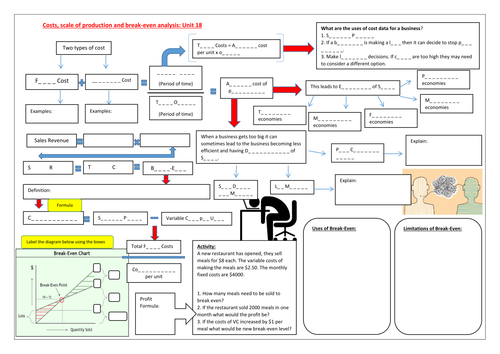

A diagram used to visually organise information on basic cost calculations, the use of cost data, economies and diseconomies of scale, break-even formula and labeling of break even graph.
Also includes mini contribution break-even activity.
This could be used as a revision activity, as a starter, plenary or main activity.
It could also be blown into A3.
Also includes mini contribution break-even activity.
This could be used as a revision activity, as a starter, plenary or main activity.
It could also be blown into A3.
Get this resource as part of a bundle and save up to 27%
A bundle is a package of resources grouped together to teach a particular topic, or a series of lessons, in one place.
Something went wrong, please try again later.
This resource hasn't been reviewed yet
To ensure quality for our reviews, only customers who have purchased this resource can review it
Report this resourceto let us know if it violates our terms and conditions.
Our customer service team will review your report and will be in touch.
£3.00