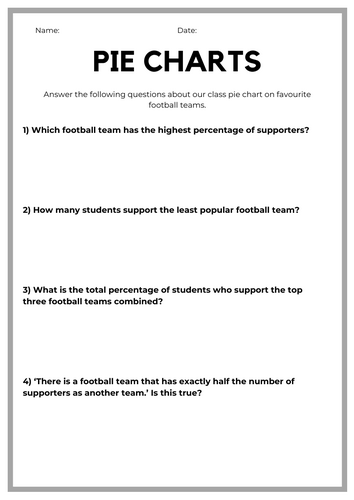


Introducing our comprehensive Year 6 maths resource package, comprising a PowerPoint presentation and accompanying worksheet, designed to teach students how to create and analyze data in pie charts. The PowerPoint offers a detailed, step-by-step guide on creating pie charts, covering data collection, conversion to percentages, and translating percentages into angles within a 360-degree circle to create chart sections. This visual aid provides clear instructions and examples to support students’ understanding. The worksheet complements the PowerPoint by providing questions that require students to apply their knowledge of data collection and analysis. Together, these resources offer a comprehensive approach to teaching pie chart creation and data interpretation skills to Year 6 students.
Something went wrong, please try again later.
This resource hasn't been reviewed yet
To ensure quality for our reviews, only customers who have purchased this resource can review it
Report this resourceto let us know if it violates our terms and conditions.
Our customer service team will review your report and will be in touch.