


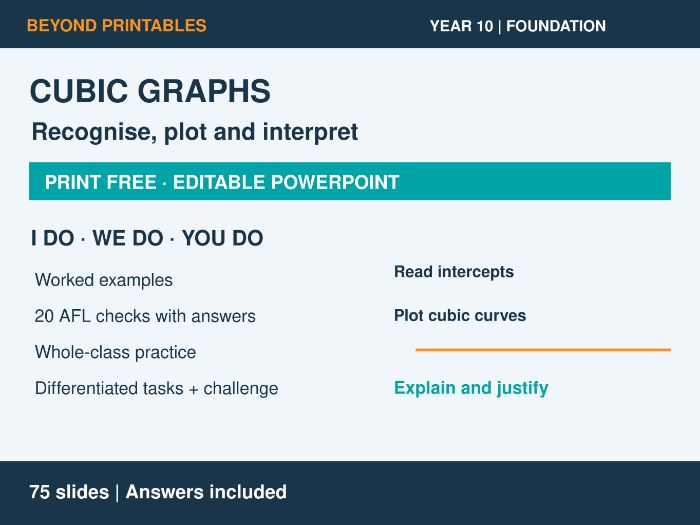
Build confidence in recognising, plotting and interpreting cubic graphs with this editable Year 10 Maths Foundation PowerPoint. Project the lesson and keep the whole class working through modelling, mini-whiteboard checks and practice in exercise books. No photocopied worksheets are required.
Pupils substitute negative and positive inputs, test whether a point lies on a curve, complete tables and sketch simple cubics. They calculate axis intercepts and distinguish cubic graphs from linear and quadratic graphs. Controlled practice develops fluency before pupils explain errors and justify conclusions.
WHAT IS INCLUDED
• One editable 75-slide PowerPoint with questions and answers.
• Six retrieval questions and six prerequisite checks, each with grouped answers.
• Key vocabulary, graph-family comparisons and a visual explanation of intercepts.
• A compact I Do / We Do page with three matched pairs and space for live teacher working.
• Separate worked solutions, including plotted curves and labelled intercept sketches where requested.
• Twenty individual AFL questions, each immediately followed by its answer.
• A 24-question whole-class practice page using four shared graphs, plus one-page answers.
• Developing, Secure and Greater Depth questions together with one Super Challenge on a single slide.
• Twenty numbered differentiated questions, grouped answers and a separate worked plotting graph.
• Two misconception checks with corrections.
• An original exam-style question with suggested marks and worked answers.
• Three exit questions, each followed by its answer.
PRINT FREE AND PRACTICAL
Short AFL questions ask pupils to calculate, identify, explain or read a displayed graph, so they suit mini whiteboards. Longer plotting tasks provide tables of values for pupils to use in their exercise books. Table entries that pupils must complete are left blank. Clear square grids and compact headings support projection while keeping useful working space available.
TEACH, CHECK AND PRACTISE
Use the paired examples to demonstrate a method and then involve the class in a different example. Reveal the worked answers when needed. The practice page keeps related questions together, and the differentiated page lets pupils work at an appropriate level without changing the screen for every group.
CHALLENGE WITH A PURPOSE
The Super Challenge tackles a misleading plot: three zero outputs appear to suggest a straight line. Pupils calculate two additional points, explain the missing curve shape and use a negative output to disprove a claim. The task develops the use of counterexamples rather than adding repetitive calculations.
READY TO ADAPT
Edit the slides to suit your class, select a practice route or revisit a misconception. The questions and suggested exam marks are original teaching materials, not an official examination paper.
Year 10 Unit 15, lesson 1, U980: Graphs of Cubic Functions. This is the Foundation pathway. Created by Beyond Printables.
Something went wrong, please try again later.
This resource hasn't been reviewed yet
To ensure quality for our reviews, only customers who have purchased this resource can review it
Report this resourceto let us know if it violates our terms and conditions.
Our customer service team will review your report and will be in touch.
£3.00