
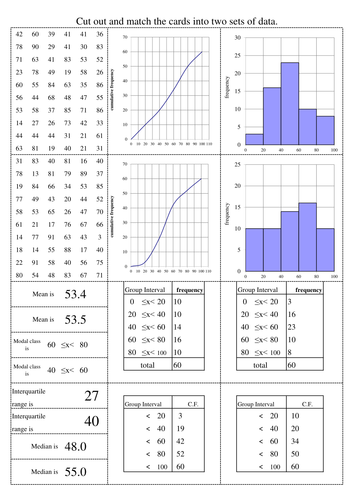
Two sets of data and corresponding statistical information. Match up the two sets by calculating and graphing.
Something went wrong, please try again later.
Thank you for publishing your resource. It has been selected to be featured in <a href="https://www.tes.com/teaching-resources/collections/secondary-maths/"> a new secondary maths collection</a>.
A challenging activity that has students match up tables with cumulative frequency graphs, frequency histograms, data and averages. There are two sets of data, and the natural extension is to get each group to design their own set of data and collect them all in to copy for the next lesson.
I love it. Thank you.
Report this resourceto let us know if it violates our terms and conditions.
Our customer service team will review your report and will be in touch.
£0.00