

A unit of work to introduce types of data and to discuss different ways of collecting data.
The zip file contains:
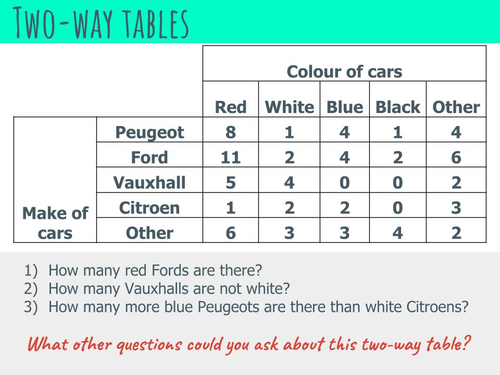
A PowerPoint (pptx) slide on two-way tables used as a lesson starter.
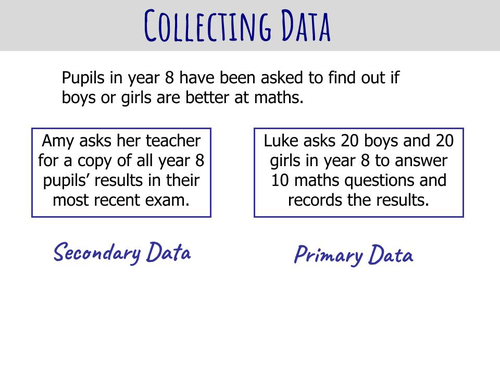
A PowerPoint (pptx) presentation that asks questions about types of data (primary/secondary, qualitative/quantitative) and data collection techniques including types of sampling. It also briefly looks at how different types of data can be represented in bar charts, frequency diagrams and histograms.
A worksheet (pdf/docx) on collecting data where students match types of data to keywords such as primary, secondary, qualitative, quantitative, discrete and continuous.
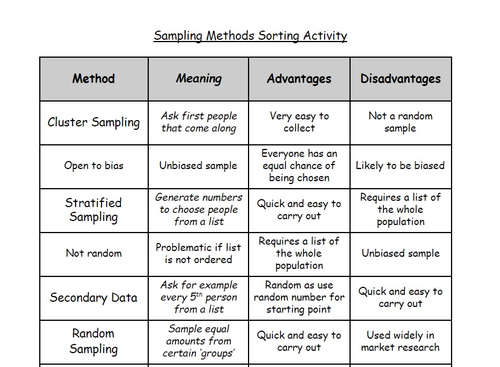
A Match-up activity (pdf/docx) on sampling methods, where students match the method with its description and some advantages and disadvantages of the technique. Includes an answer sheet.
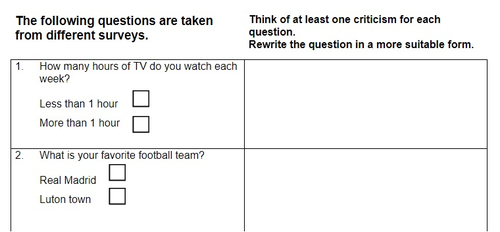
A worksheet (pdf/docx) about surveys showing 7 different survey questions. Students are asked for one criticism of each question and to rewrite it in a more suitable form.
A worksheet (pdf/docx) about representing data containing 5 questions. Each question has a table containing data and students are asked to draw 2 bar charts, a pie chart, a line graph and a scatter graph. This is a good revision exercise to remind students of the variety of graphs they already know how to draw.
Something went wrong, please try again later.
This resource hasn't been reviewed yet
To ensure quality for our reviews, only customers who have purchased this resource can review it
Report this resourceto let us know if it violates our terms and conditions.
Our customer service team will review your report and will be in touch.
£2.00