


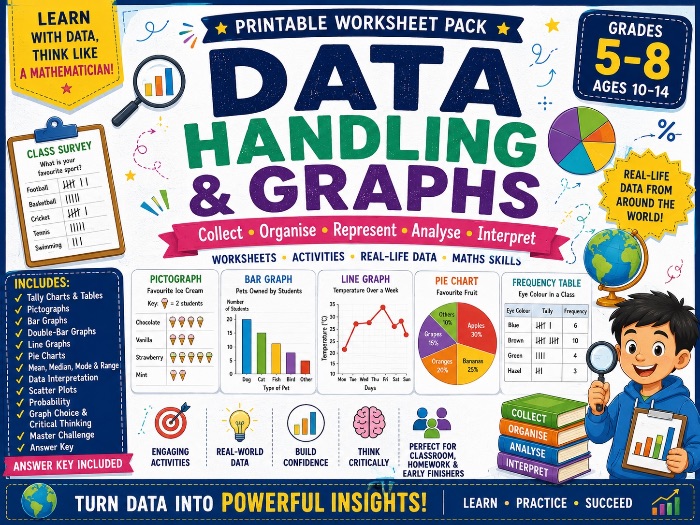
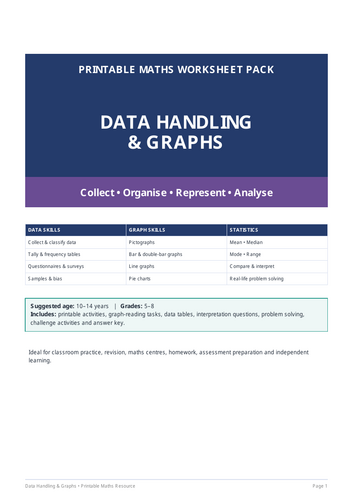
This is a comprehensive printable maths resource designed for students aged approximately 10-14 years (Grades 5-8). It takes students through the complete data-handling process,from collecting and organizing data to representing, analyzing and interpreting it.
Topics Covered
- Collecting & Classifying Data
- Tally Charts & Frequency Tables
- Pictographs
- Bar Graphs
- Double-Bar Graphs
- Line Graphs & Trends
- Pie Charts
- Mean, Median, Mode & Range
- Reading & Interpreting Data
- Graph Choice & Critical Thinking
- Data Handling Master Challenge
The pack also includes Scatter Plots & Relationships and a Data & Probability Challenge, extending the resource into relationships between numerical variables and experimental probability.
he worksheets encourage students to develop:
Data collection and organization
Graph construction
Statistical calculation
Data interpretation
Mathematical reasoning
Critical thinking
Comparison skills
Real-life problem solving
Ability to choose an appropriate data representation
Something went wrong, please try again later.
This resource hasn't been reviewed yet
To ensure quality for our reviews, only customers who have purchased this resource can review it
Report this resourceto let us know if it violates our terms and conditions.
Our customer service team will review your report and will be in touch.
£2.00