

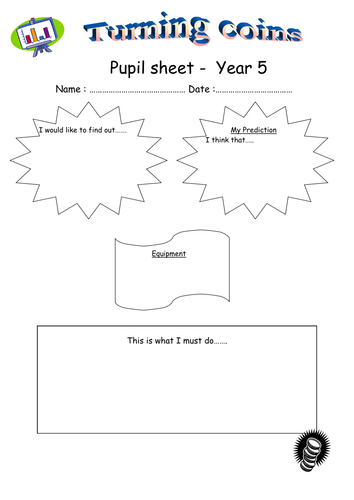

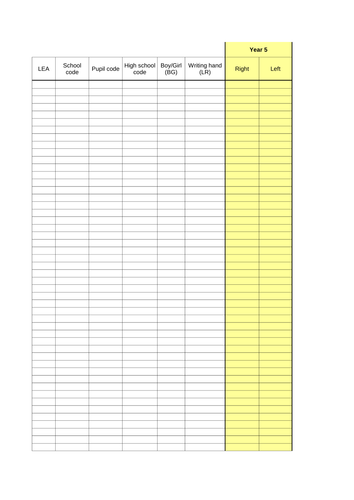

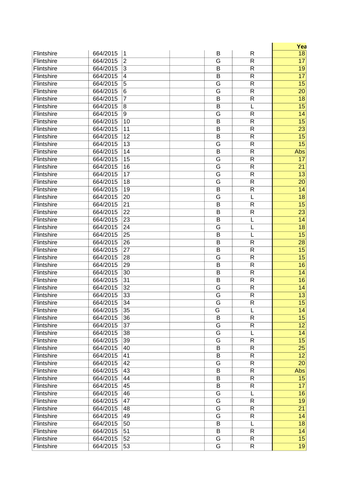
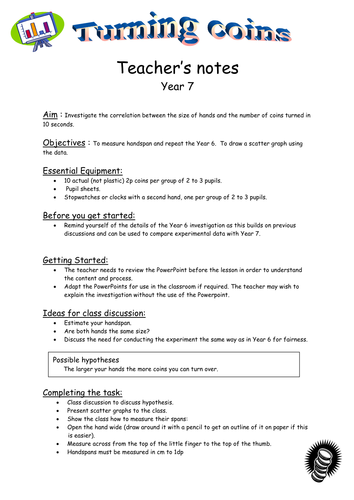


This transition project allows pupils to handle data in a real life context. The work is split from Years 5 to 8, with opportunity for groups to revisit the previous year’s results. Year 5 collects discrete data, finds the mode and range and displays the results on an interactive bar graph. Year 6 collects discrete data, finds the mode, median, mean and range and displays their results on an interactive pictogram. Year 7 collects discrete data and displays their data on an interactive scatter diagram. Year 8 collects and analyses continuous data using an interactive reaction timer.
Something went wrong, please try again later.
Great simple and practical
Looks v good
Report this resourceto let us know if it violates our terms and conditions.
Our customer service team will review your report and will be in touch.
£0.00