


Are you looking to transform your students from passive number-crunchers into sharp, critical thinkers? Go beyond rote memorization of formulas with this comprehensive Data Literacy and Statistics curriculum designed to build true analytical skills for the 21st century.
In a world saturated with data, misinformation, and misleading graphs, statistical literacy is no longer optional—it’s an essential life skill. This all-in-one digital resource is meticulously crafted for high school and introductory college-level classrooms, providing everything you need to guide students on a journey from core theory to real-world application. This isn’t just another packet of math problems; it’s a framework for thinking.
Students will move beyond “what” to “why,” learning to question data, identify bias, deconstruct misleading visualizations, and understand the profound difference between correlation and causation. With engaging, relevant examples (from e-sports to medical studies) and rigorous case studies, this unit makes abstract concepts tangible and memorable.
WHAT’S INCLUDED (45-Page PDF):
Phase 1: Core Content & Theory: A 14-page “textbook” style guide that clearly explains foundational concepts.
The Anatomy of Data (Qualitative, Quantitative, Discrete, Continuous, Levels of Measurement)
Descriptive Statistics (Mean, Median, Mode, Variance, Standard Deviation, IQR)
Data Visualization & Misrepresentation (Anscombe’s Quartet, Truncated Axes, The Bubble Fallacy)
Probability, Correlation, and Causation (Spurious Correlations, Confounding Variables)
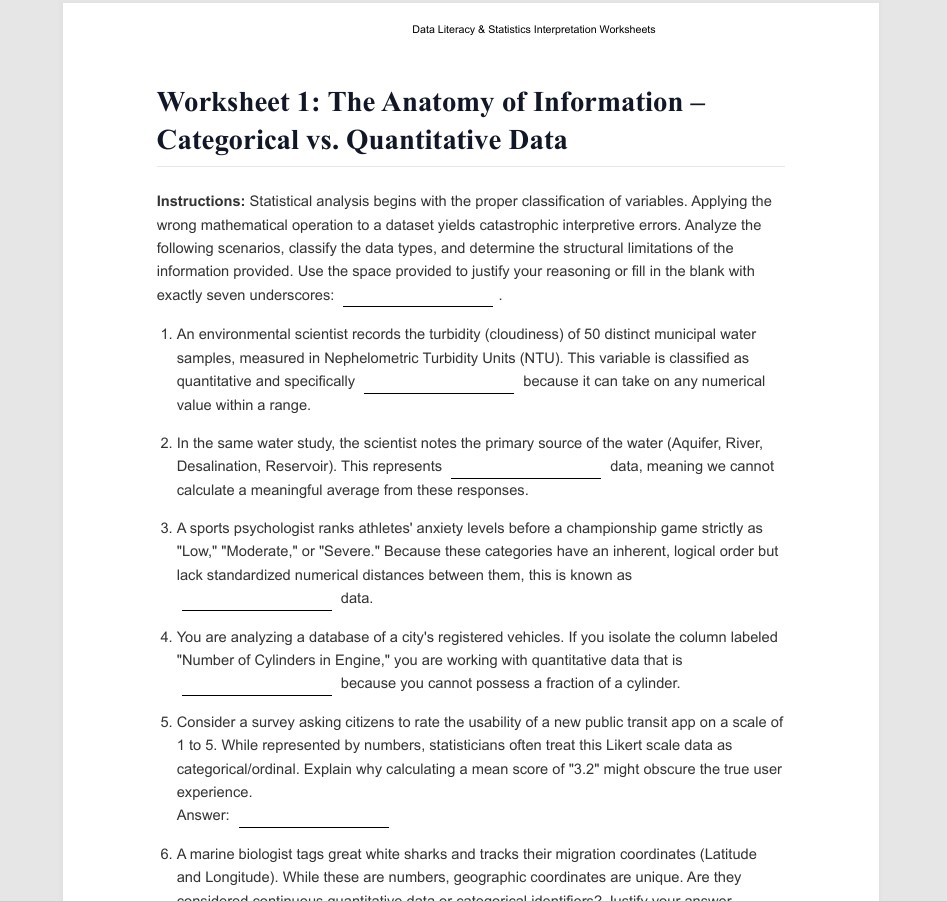
Phase 2: Student Workbook: 10 detailed, multi-question worksheets (20 pages) that challenge students to apply the theory. Topics include:
Categorical vs. Quantitative Data
Contextualizing Mean, Median, and Mode
Variance, Spread, and Dispersion
Decoding Histograms and Box Plots
Correlation vs. Causation
Probability and Expected Value
Sampling Methodologies and Bias
The Normal Curve (68-95-99.7 Rule) & Z-Scores
Margins of Error & Confidence Intervals
The Ethics of Metrics & Misleading Statistics
Phase 3: Visuals & Teacher Resources:
3 High-Quality Conceptual Visualizations (SVG): Perfect for classroom projection or as student handouts (PPDAC Cycle, Distribution Shapes, Confounding Variables).
A Comprehensive 7-Page Teacher Answer Key: Includes not just the answers, but pedagogical justifications to guide classroom discussions and deepen student understanding.
This resource is perfect for a full unit in a statistics course, a supplement for an Algebra 2 or Pre-Calculus class, an AP Statistics review, or a homeschool curriculum. Empower your students with the defensive armor of statistical literacy. Download today and start building a more data-savvy generation!
Keywords: Data Literacy, Statistics Worksheets, AP Statistics, High School Math, Mean Median Mode, Correlation Causation, Normal Distribution, Z-scores, Data Visualization, Critical Thinking, Real-World Data, Statistics Project, Answer Key Included, Digi
Something went wrong, please try again later.
This resource hasn't been reviewed yet
To ensure quality for our reviews, only customers who have purchased this resource can review it
Report this resourceto let us know if it violates our terms and conditions.
Our customer service team will review your report and will be in touch.
$25.00