Unlock the power of data visualization with AI tools in this complete, ready-to-use 38-page student workbook and teacher resource pack! Designed for modern classrooms, this comprehensive guide transforms raw data into compelling visual stories through advanced analytical charting, ethical practices, and hands-on worksheets.
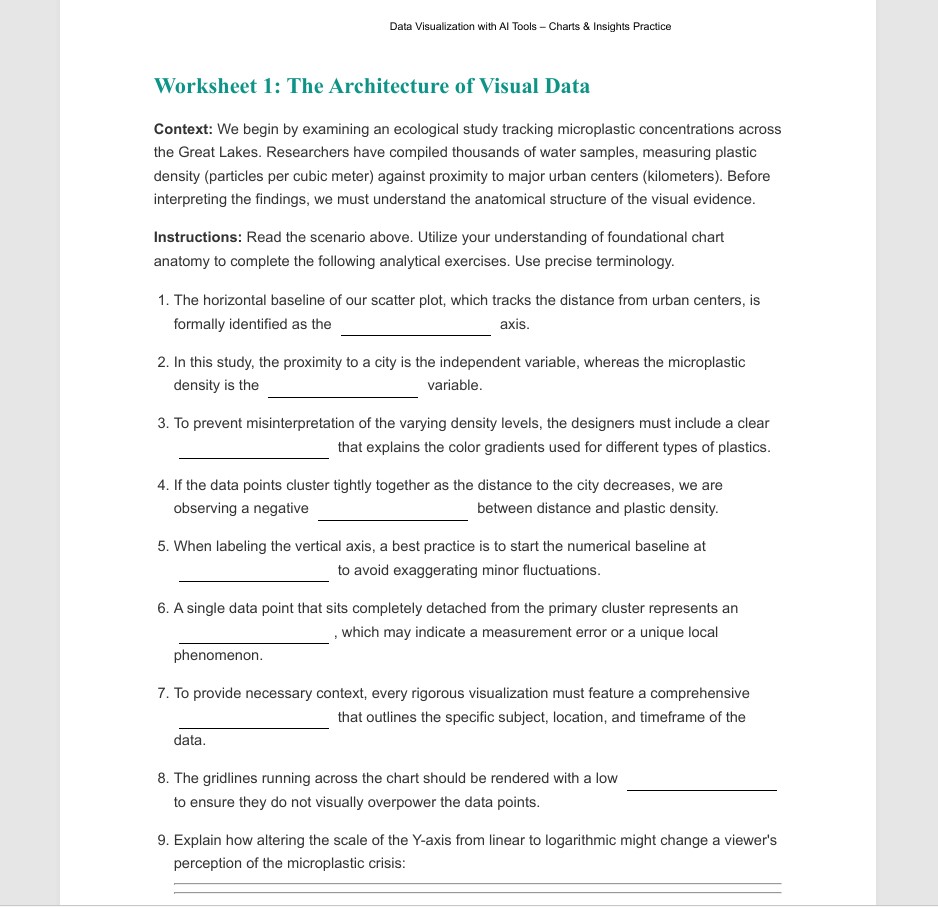
Students master essential chart types (bar, line, scatter plots, histograms, stacked bars, and more), learn to avoid misleading visuals, extract actionable insights, and use computational/AI platforms to analyze real-world datasets like urban heat islands, microplastics, butterfly migration, and school nutrition.
Includes:
Full theory guide with methodology, Gestalt principles, and “So What?” insight protocol
10 engaging worksheets with real scenarios (ecology, agriculture, urban planning, ethics)
Instructional visuals, chart selection matrix, and epistemic workflow diagrams
Complete teacher keys, rubrics, and answer guides (Part 3)
Perfect for building data literacy, critical thinking, and AI-assisted analysis skills. No prep needed — just print or assign digitally. Ideal for data science, statistics, STEM, computer science, or environmental studies. Boost student engagement with professional-grade visuals that prepare them for college and careers in a data-driven world.
Keywords: data visualization workbook, AI tools for charts, student data analysis practice, data literacy worksheets, ethical data viz, teacher resources for charts, scatter plot histogram practice, high school data science curriculum.
Why Parents/Schools Love It:
Builds Future-Ready Skills: Teaches AI-powered data visualization and ethical analysis — critical 21st-century competencies that colleges and employers demand.
Zero Prep, Maximum Engagement: Complete student workbook + teacher keys/rubrics mean teachers save hours while students get professional, real-world practice.
Promotes Critical Thinking & Ethics: Goes far beyond “make a pretty chart” — students learn to spot misleading data, avoid bias, and extract meaningful insights.
Cross-Curricular & Inclusive: Works across science, math, social studies, and computer science with diverse real-world examples (ecology, urban planning, nutrition, migration).
Differentiated & Accessible: Clear scaffolding, visuals, and fill-in checkpoints support all learners while challenging advanced students.
Target Student Levels (Based on Full PDF Analysis):
This resource is perfectly pitched for grades 8–12 (middle school advanced through high school), especially:
High school Data Science, Statistics, AP Statistics, Computer Science, or STEM/Environmental Science classes (grades 9–12)
Advanced middle school (grades 7–8) data literacy or project-based learning programs
Intro-level college or vocational data visualization courses (as a foundational workbook)
Something went wrong, please try again later.
This resource hasn't been reviewed yet
To ensure quality for our reviews, only customers who have purchased this resource can review it
Report this resourceto let us know if it violates our terms and conditions.
Our customer service team will review your report and will be in touch.
£15.00