pdf, 274.42 KB
pdf, 274.42 KB
pdf, 210.36 KB
pdf, 210.36 KB

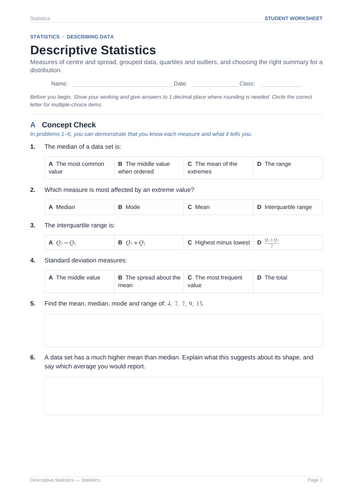
Master descriptive statistics with this Geometry and Data Analysis worksheet! Covers measures of central tendency and spread, grouped data calculations, box plot construction and interpretation, outlier testing, comparing distributions, linear transformations of data, and answer key.

This comprehensive 5-page student worksheet is designed to help Geometry and Statistics students master key concepts in descriptive statistics and data representation. It guides learners step-by-step from core definitions of center and spread to computing grouped estimates, reading histograms and box plots, testing for outliers, and analyzing how transformations affect statistical measures.

What is Included:

Section A: Concept Check. Evaluates foundational understanding of measures of center (mean, median, mode) and spread (range, IQR, standard deviation), identifying the impact of extreme values, and determining appropriate averages for skewed distributions.

Section B: Measures of Centre. Focuses on calculating mean, median, and mode for odd and even data sets, solving for missing values given a mean, updating combined averages when new data points join, and identifying contexts where the mode is the primary measure.

Section C: Measures of Spread. Guides students through calculating range, quartiles (Q1, Q2, Q3), interquartile range (IQR), and standard deviation, comparing variability between data sets, and applying the 1.5 x IQR rule to detect outliers.

Section D: Grouped Data. Covers estimating the mean using class midpoints, identifying modal and median classes, understanding why grouped means are approximations, and evaluating histogram skewness.

Section E: Box Plots and Comparison. Focuses on reading 5-number summaries and interquartile ranges directly from box plots, constructing accurate box plots from given summary statistics, and writing formal comparisons of center and spread between distributions.

Section F: Applications and Challenge. Features conceptual challenge problems analyzing how adding or multiplying constants affects mean, median, range, and standard deviation, as well as calculating how removing specific values alters the overall mean.

Teacher Benefits:

Ready to Print & Go – Zero prep required. Excellent for structured classroom instruction, targeted homework, review sessions, or assessment preparation.

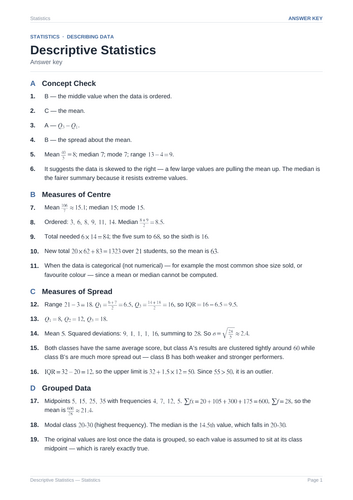
Complete Solutions Included – Comes with a fully worked answer key detailing conceptual checks, step-by-step arithmetic setups, exact decimal evaluations, and distribution comparisons.

Get this resource as part of a bundle and save up to 29%

A bundle is a package of resources grouped together to teach a particular topic, or a series of lessons, in one place.

Bundle

Statistics and Data Analysis Comprehensive Worksheet Bundle

Equip your high school mathematics classroom with this complete, high-impact collection of practice worksheets and full answer keys! Covering essential topics from descriptive statistics and data representation to advanced probability, sampling design, and statistical inference, this bundle provides everything needed to build deep conceptual understanding and analytical fluency. **What is Included** Correlation and Linear Regression Practice & Key: Focuses on describing scatter graph correlation, interpreting Pearson's correlation coefficient, fitting least-squares regression lines, predicting values via interpolation vs. extrapolation, and identifying lurking variables. Basic Probability Practice & Key: Covers sample spaces, single and combined events, addition and multiplication rules, tree diagrams, dependent and independent sampling, expected frequency, and mathematical expectation in games. Conditional Probability and Independence Practice & Key: Explores extracting probabilities from two-way contingency tables, testing for independence, multi-stage sampling without replacement, and applying Bayes' theorem to invert conditional probabilities. Probability Distributions Practice & Key: Focuses on discrete random variables and expected values, binomial experiments, symmetrical normal distributions, standardizing values with z-scores, and evaluating distribution assumptions. Permutations and Combinations Practice & Key: Covers the fundamental counting principle, factorials, ordered arrangements (permutations), unordered selections (combinations), circular permutations, team partitioning, and counting applications in probability. Sampling and Experimental Design Practice & Key: Explores population vs. sample parameters, implementing various sampling methods, identifying survey biases, distinguishing observational studies from controlled experiments, and principles of experimental design. Data Representation Practice & Key: Focuses on choosing appropriate visual displays, constructing pie charts, stem-and-leaf diagrams, box plots, histograms, cumulative frequency curves, and scatter plots, as well as evaluating misleading graphical displays. Descriptive Statistics Practice & Key: Covers measures of central tendency and spread, grouped data calculations, constructing and interpreting box plots, testing for outliers using the 1.5 x IQR rule, comparing distributions, and analyzing linear data transformations. **Teacher Benefits** Ready to Print & Go: Zero prep required. Excellent for structured classroom lessons, targeted homework assignments, independent practice, sub plans, or unit exam preparation. Complete Step-by-Step Answer Keys: Includes fully worked solutions detailing conceptual checks, exact fraction and decimal evaluations, tree diagram setups, and step-by-step statistical reasoning. Scaffolded & Comprehensive: Each resource progresses logically from core vocabulary and definitions to multi-step calculations, graphical analyses, and real-world statistical applications.

£19.99

Reviews

Something went wrong, please try again later.

This resource hasn't been reviewed yet

To ensure quality for our reviews, only customers who have purchased this resource can review it

Report this resourceto let us know if it violates our terms and conditions.
Our customer service team will review your report and will be in touch.