
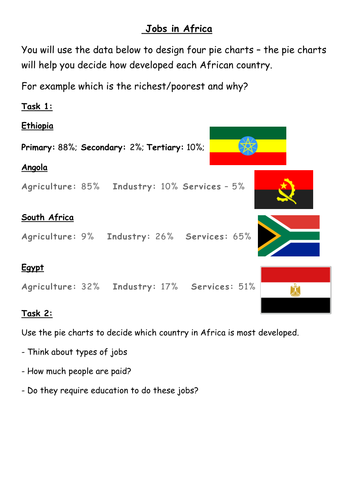
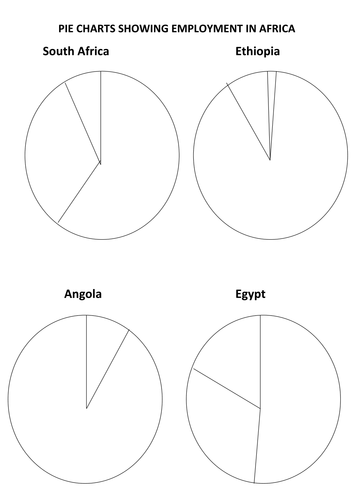
Numeracy activity looking at the creation pie charts to compare development in Africa.
Students will need to reach a conclusion based upon which country is most developed after creating pie charts.
Countries included: Angola, Ethiopia, South Africa and Egypt
Students will need to reach a conclusion based upon which country is most developed after creating pie charts.
Countries included: Angola, Ethiopia, South Africa and Egypt
Something went wrong, please try again later.
This resource hasn't been reviewed yet
To ensure quality for our reviews, only customers who have purchased this resource can review it
Report this resourceto let us know if it violates our terms and conditions.
Our customer service team will review your report and will be in touch.
£3.00