
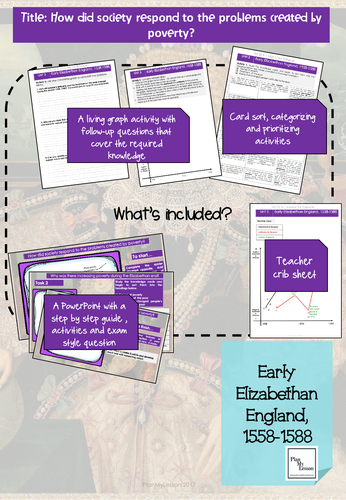
Students create a graph to show how attitudes and the treatment of the poor changed in the period. They then link these changes to key events in the period, such as the Spanish Fury and poor harvests. They use their completed graph complete tasks and an exam question. Step by step instructions and differentiated resources included.
Get this resource as part of a bundle and save up to 27%
A bundle is a package of resources grouped together to teach a particular topic, or a series of lessons, in one place.
Bundle
Edexcel GCSE Early Elizabethan England Unit 3
Everything needed to teach the final unit of the Early Elizabethan England Unit 3. If you are familiar with our lessons you will know that each enquiry includes high-quality resources, exam style questions and tips, differentiated activities and clear step by step instructions. No textbook required.
£17.49
Bundle
Edexcel GCSE Early Elizabethan England Complete Unit of Work
Everything needed to successfully teach the early Elizabethan England course, This bundle includes 19 enquiry based lessons. Each lesson includes a powerpoint presentation with a step by step guide and activities, high quality worksheets, engaging activities, exam questions and support material.
£48.99
Something went wrong, please try again later.
This resource hasn't been reviewed yet
To ensure quality for our reviews, only customers who have purchased this resource can review it
Report this resourceto let us know if it violates our terms and conditions.
Our customer service team will review your report and will be in touch.
£3.49