
This lesson is designed for the Edexcel Psychology (9-1) New Specification, and contains everything you could possibly need for the 22nd lesson, Interpreting Graphs!
This package contains the whole lesson Powerpoint, a differentiated starter, lots of fully differentiated activities and differentiated worksheets with accompanying answers, all designed to get your students up to standard with their maths! The whole lesson is designed in a ‘pick up and teach it’ way, that means everything you could possibly need is all there for you.
There are lots of engaging and interesting activities, designed to keep your classes motivated, engaged and making the best progress that they can within the lesson, as well as providing plenty of opportunities for stretch and challenge.
Objectives covered in this lesson are as follows:
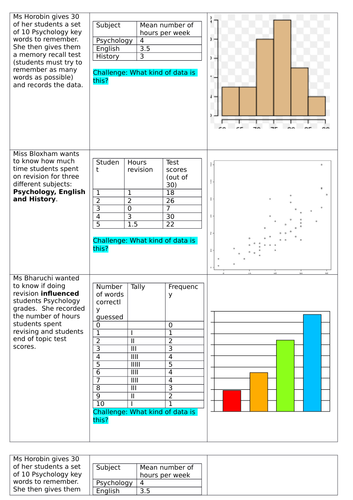
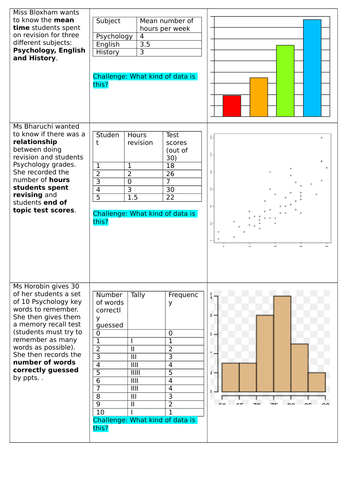
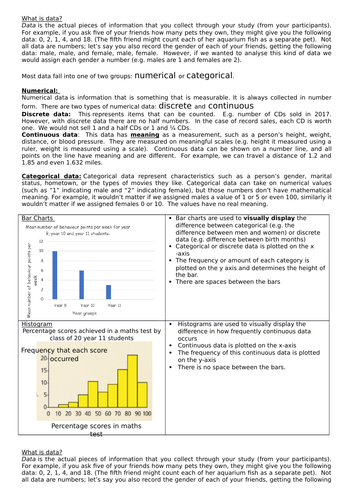
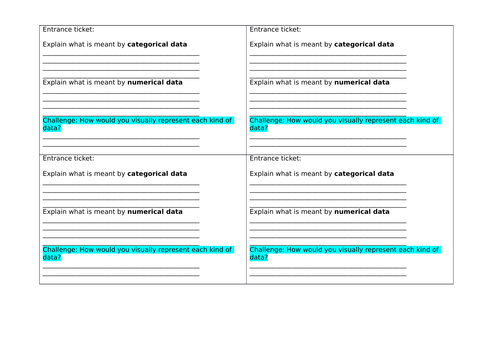
- Identify the difference between categorical and numerical data
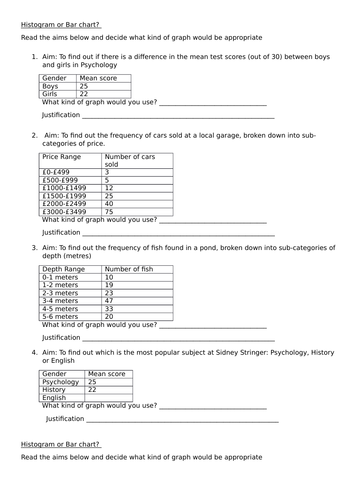
- Explain when to use a bar chart, histogram and scatter diagram
- Discuss key differences between bar charts and histograms
Something went wrong, please try again later.
This resource hasn't been reviewed yet
To ensure quality for our reviews, only customers who have purchased this resource can review it
Report this resourceto let us know if it violates our terms and conditions.
Our customer service team will review your report and will be in touch.
£2.50