


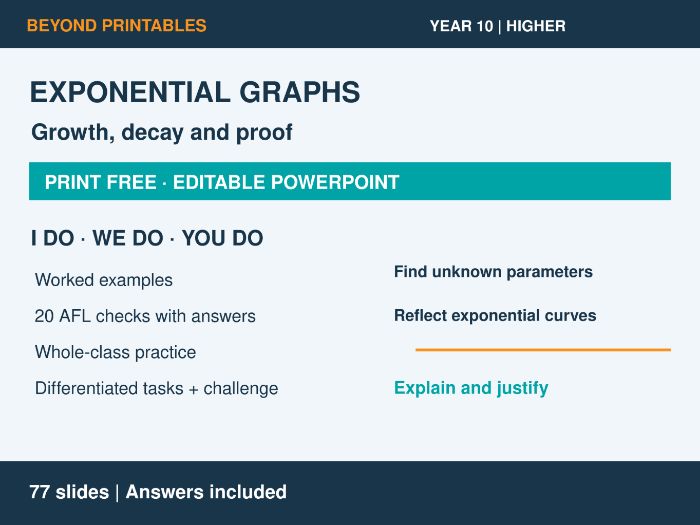
Move beyond plotting exponential curves and develop confident GCSE Higher reasoning with this editable Year 10 Maths PowerPoint. Pupils calculate outputs, interpret growth and decay, recover unknown parameters and justify conclusions. Project the lesson and keep the class active with mini-whiteboard checks and exercise-book practice, without photocopied worksheets.
FROM MODELLING TO INDEPENDENT THINKING
Three matched I Do / We Do pairs support live teaching, with compact instructions and space for teacher working. Pupils complete tables, plot growth and decay curves and find an equation from two points. Fractional bases, negative powers and reflections help pupils connect notation with the shape of a graph.
WHAT IS INCLUDED
• One editable 77-slide PowerPoint with questions and answers.
• Six retrieval questions and six prerequisite checks, with grouped answers.
• Key vocabulary and visual explanations of growth, decay and asymptotes.
• Three paired I Do / We Do examples with worked solutions.
• Twenty individual AFL questions, each immediately followed by its answer.
• A 26-question whole-class practice page and one-page answers.
• Twenty-four differentiated questions across Developing, Secure and Greater Depth, plus one Super Challenge on the same slide.
• Grouped differentiated answers and additional worked plotting and challenge solutions.
• Mixed graph-family matching, including exponential, cubic and reciprocal graphs.
• Two misconception checks with corrections.
• An original eight-mark exam-style question with worked answers.
• Three exit questions, each followed by its answer.
HIGHER DEPTH THROUGHOUT
Find a and b in y = a × bˣ, including from points whose x-coordinates are not consecutive. Compare reflections in the coordinate axes, distinguish a negative multiplier from a negative exponent, and decide whether a set of points can lie on one exponential curve. Greater Depth includes proving a relationship between consecutive outputs and explaining why equal percentage changes do not produce equal cash changes.
A SUPER CHALLENGE THAT REQUIRES REASONING
Find where two exponential curves meet, prove that the intersection is unique and generalise the relationship between their coefficients and the intersection height.
PRINT FREE AND PRACTICAL
Short AFL checks focus on calculation, interpretation and explanation. Longer plotting tasks supply tables for pupils to use in exercise books; missing entries are left blank. Square grids, clear axes and shared figures support projection. The whole-class differentiated slide keeps all groups working from one screen, with a separate space for the Super Challenge.
READY TO ADAPT
Edit examples, choose a practice route or revisit a misconception. Questions and suggested exam marks are original teaching materials, not an official examination paper.
Year 10 Unit 15, lesson 3, U229: Graphs of Exponential Functions. Higher pathway. Created by Beyond Printables.
Something went wrong, please try again later.
This resource hasn't been reviewed yet
To ensure quality for our reviews, only customers who have purchased this resource can review it
Report this resourceto let us know if it violates our terms and conditions.
Our customer service team will review your report and will be in touch.
£3.00