
I have a particularly boy heavy year 3 class (2:1) and I used this as a way to get the boys more enthused with a maths lesson. The children really loved this, particularly to see what their football teams were like in comparison to others.
This lesson basically uses the league tables and incorporated their understanding of comparing numbers as well as consolidating their understanding of place value. The children first had to order the number from biggest to smallest. Once they had done that, the children were required to answer the questions given.
I have given two documents.
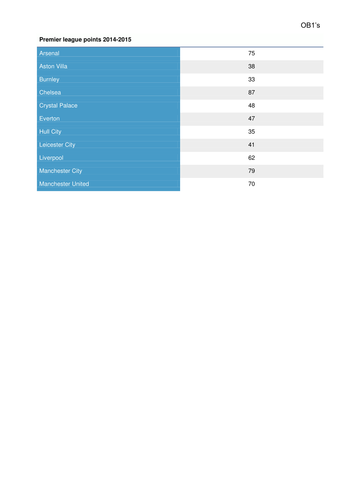
Maths data for football - provides three differentiated sheets. Sheet one gives the top ten teams for the premier league 2014-2015. Sheet two provides all 20. Sheet three provides the average attendance figures for all 20 teams for 2014-2015.
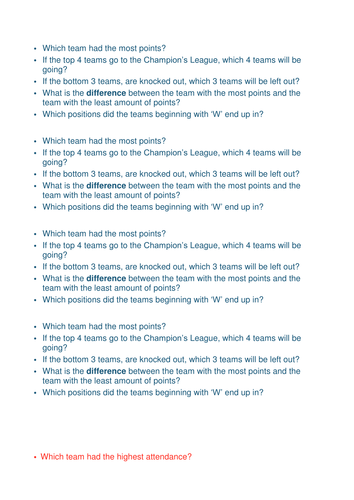
Maths questions to solve - provides two differentiated sheets. There are a range of questions that allows the children to solve based on the information given.
Edit for the third sheet on maths data for football. I did find that some children MA+ struggled with all 20 teams and would have probably benefitted from just using 10 teams.
This lesson basically uses the league tables and incorporated their understanding of comparing numbers as well as consolidating their understanding of place value. The children first had to order the number from biggest to smallest. Once they had done that, the children were required to answer the questions given.
I have given two documents.
Maths data for football - provides three differentiated sheets. Sheet one gives the top ten teams for the premier league 2014-2015. Sheet two provides all 20. Sheet three provides the average attendance figures for all 20 teams for 2014-2015.
Maths questions to solve - provides two differentiated sheets. There are a range of questions that allows the children to solve based on the information given.
Edit for the third sheet on maths data for football. I did find that some children MA+ struggled with all 20 teams and would have probably benefitted from just using 10 teams.
Something went wrong, please try again later.
This resource hasn't been reviewed yet
To ensure quality for our reviews, only customers who have purchased this resource can review it
Report this resourceto let us know if it violates our terms and conditions.
Our customer service team will review your report and will be in touch.
£1.67