


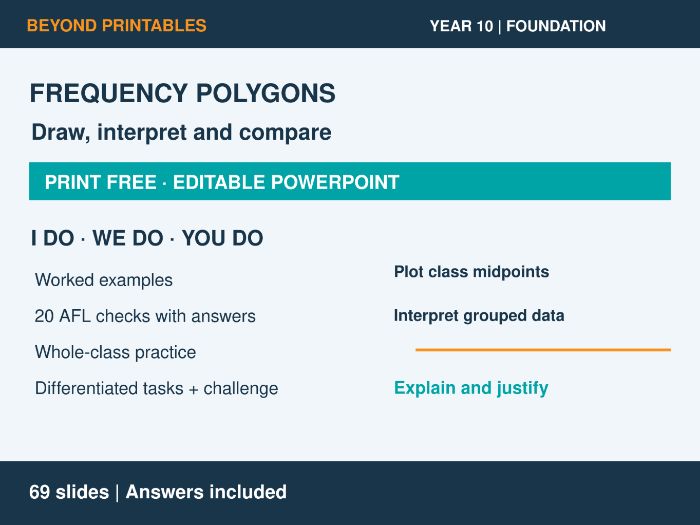
Teach drawing and interpreting frequency polygons with this editable Year 10 Maths Foundation lesson. Pupils connect grouped frequency tables to plotted midpoints, read frequencies from polygons, compare distributions and estimate means. The print-free PowerPoint includes modelling, practice and answers.
WHAT IS INCLUDED
• One editable 69-slide PowerPoint with answers.
• Six retrieval questions and six prerequisite questions, each with grouped answers.
• Explanations of class intervals, midpoints, frequencies and modal classes.
• Six I Do / We Do examples arranged in three matched pairs, with different data and worked answers.
• Twenty individual AFL questions, each immediately followed by its answer.
• Eight drawing tasks using grouped frequency tables, with completed graph answers.
• Twenty-two interpretation questions on one whole-class practice slide, using three shared figures.
• All interpretation practice answers together on one page.
• Developing, Secure and Greater Depth tasks with one Super Challenge on the same differentiated page.
• Differentiated answers and a complete challenge explanation.
• Three misconception checks with explained answers.
• An original six-mark exam-style question with answers and suggested marking points.
• Three exit questions, each immediately followed by its answer.
MODELLING THAT USES THE DIAGRAMS
The first matched pair asks pupils to state all plotting coordinates from a frequency table. The second uses a displayed polygon to complete missing frequencies in a table with supplied class intervals. The third asks for an estimated mean from a polygon. A prominent note supplies the intervals for all six examples, and the mean questions refer pupils to that note.
WHOLE-CLASS PRACTICE
Drawing tasks vary class widths and frequencies, including a zero-frequency class. Interpretation practice moves through reading frequencies, finding totals and modal classes, counting observations in specified classes, estimating means and comparing two groups.
DIFFERENTIATION WITH DEPTH
Developing secures plotting coordinates, totals and modal classes. Secure includes estimated means and explaining how a change in frequencies affects a mean. Greater Depth explores the smallest and largest possible counts above a value within a class, and whether a proposed exact mean is possible.
ONE SUPER CHALLENGE
Pupils construct two data sets that match the same polygon but have different exact means. They calculate both means, then use class boundaries to prove whether a proposed mean is possible.
PRINT FREE AND PRACTICAL
Project the slides while pupils answer in exercise books or on mini whiteboards. AFL uses short responses rather than drawing full graphs. Drawing practice needs squared exercise books and rulers, with no printed worksheets required. Graphs, tables and text remain editable.
Year 10 Unit 18, lesson 5, U840. Original questions from Beyond Printables.
Something went wrong, please try again later.
This resource hasn't been reviewed yet
To ensure quality for our reviews, only customers who have purchased this resource can review it
Report this resourceto let us know if it violates our terms and conditions.
Our customer service team will review your report and will be in touch.
£3.00