Tired of planning? This resource is included in a bundle. Save money and get instant access to any of these bundles below:
Data Representation and Pie Charts Bundle
Statistics Bundle
⸻
Description:
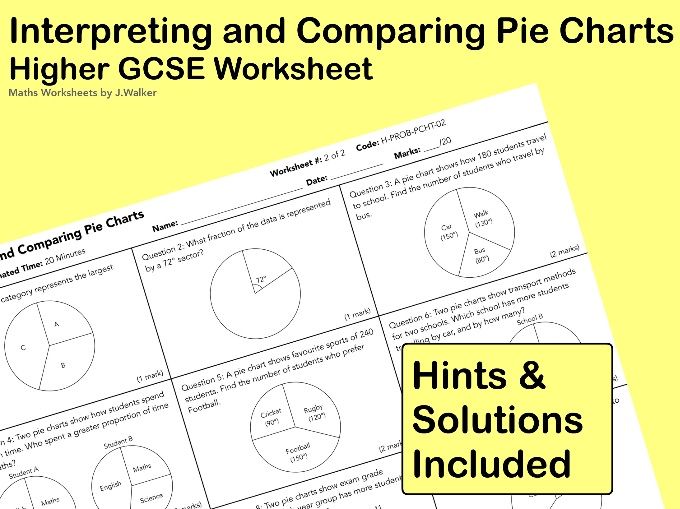
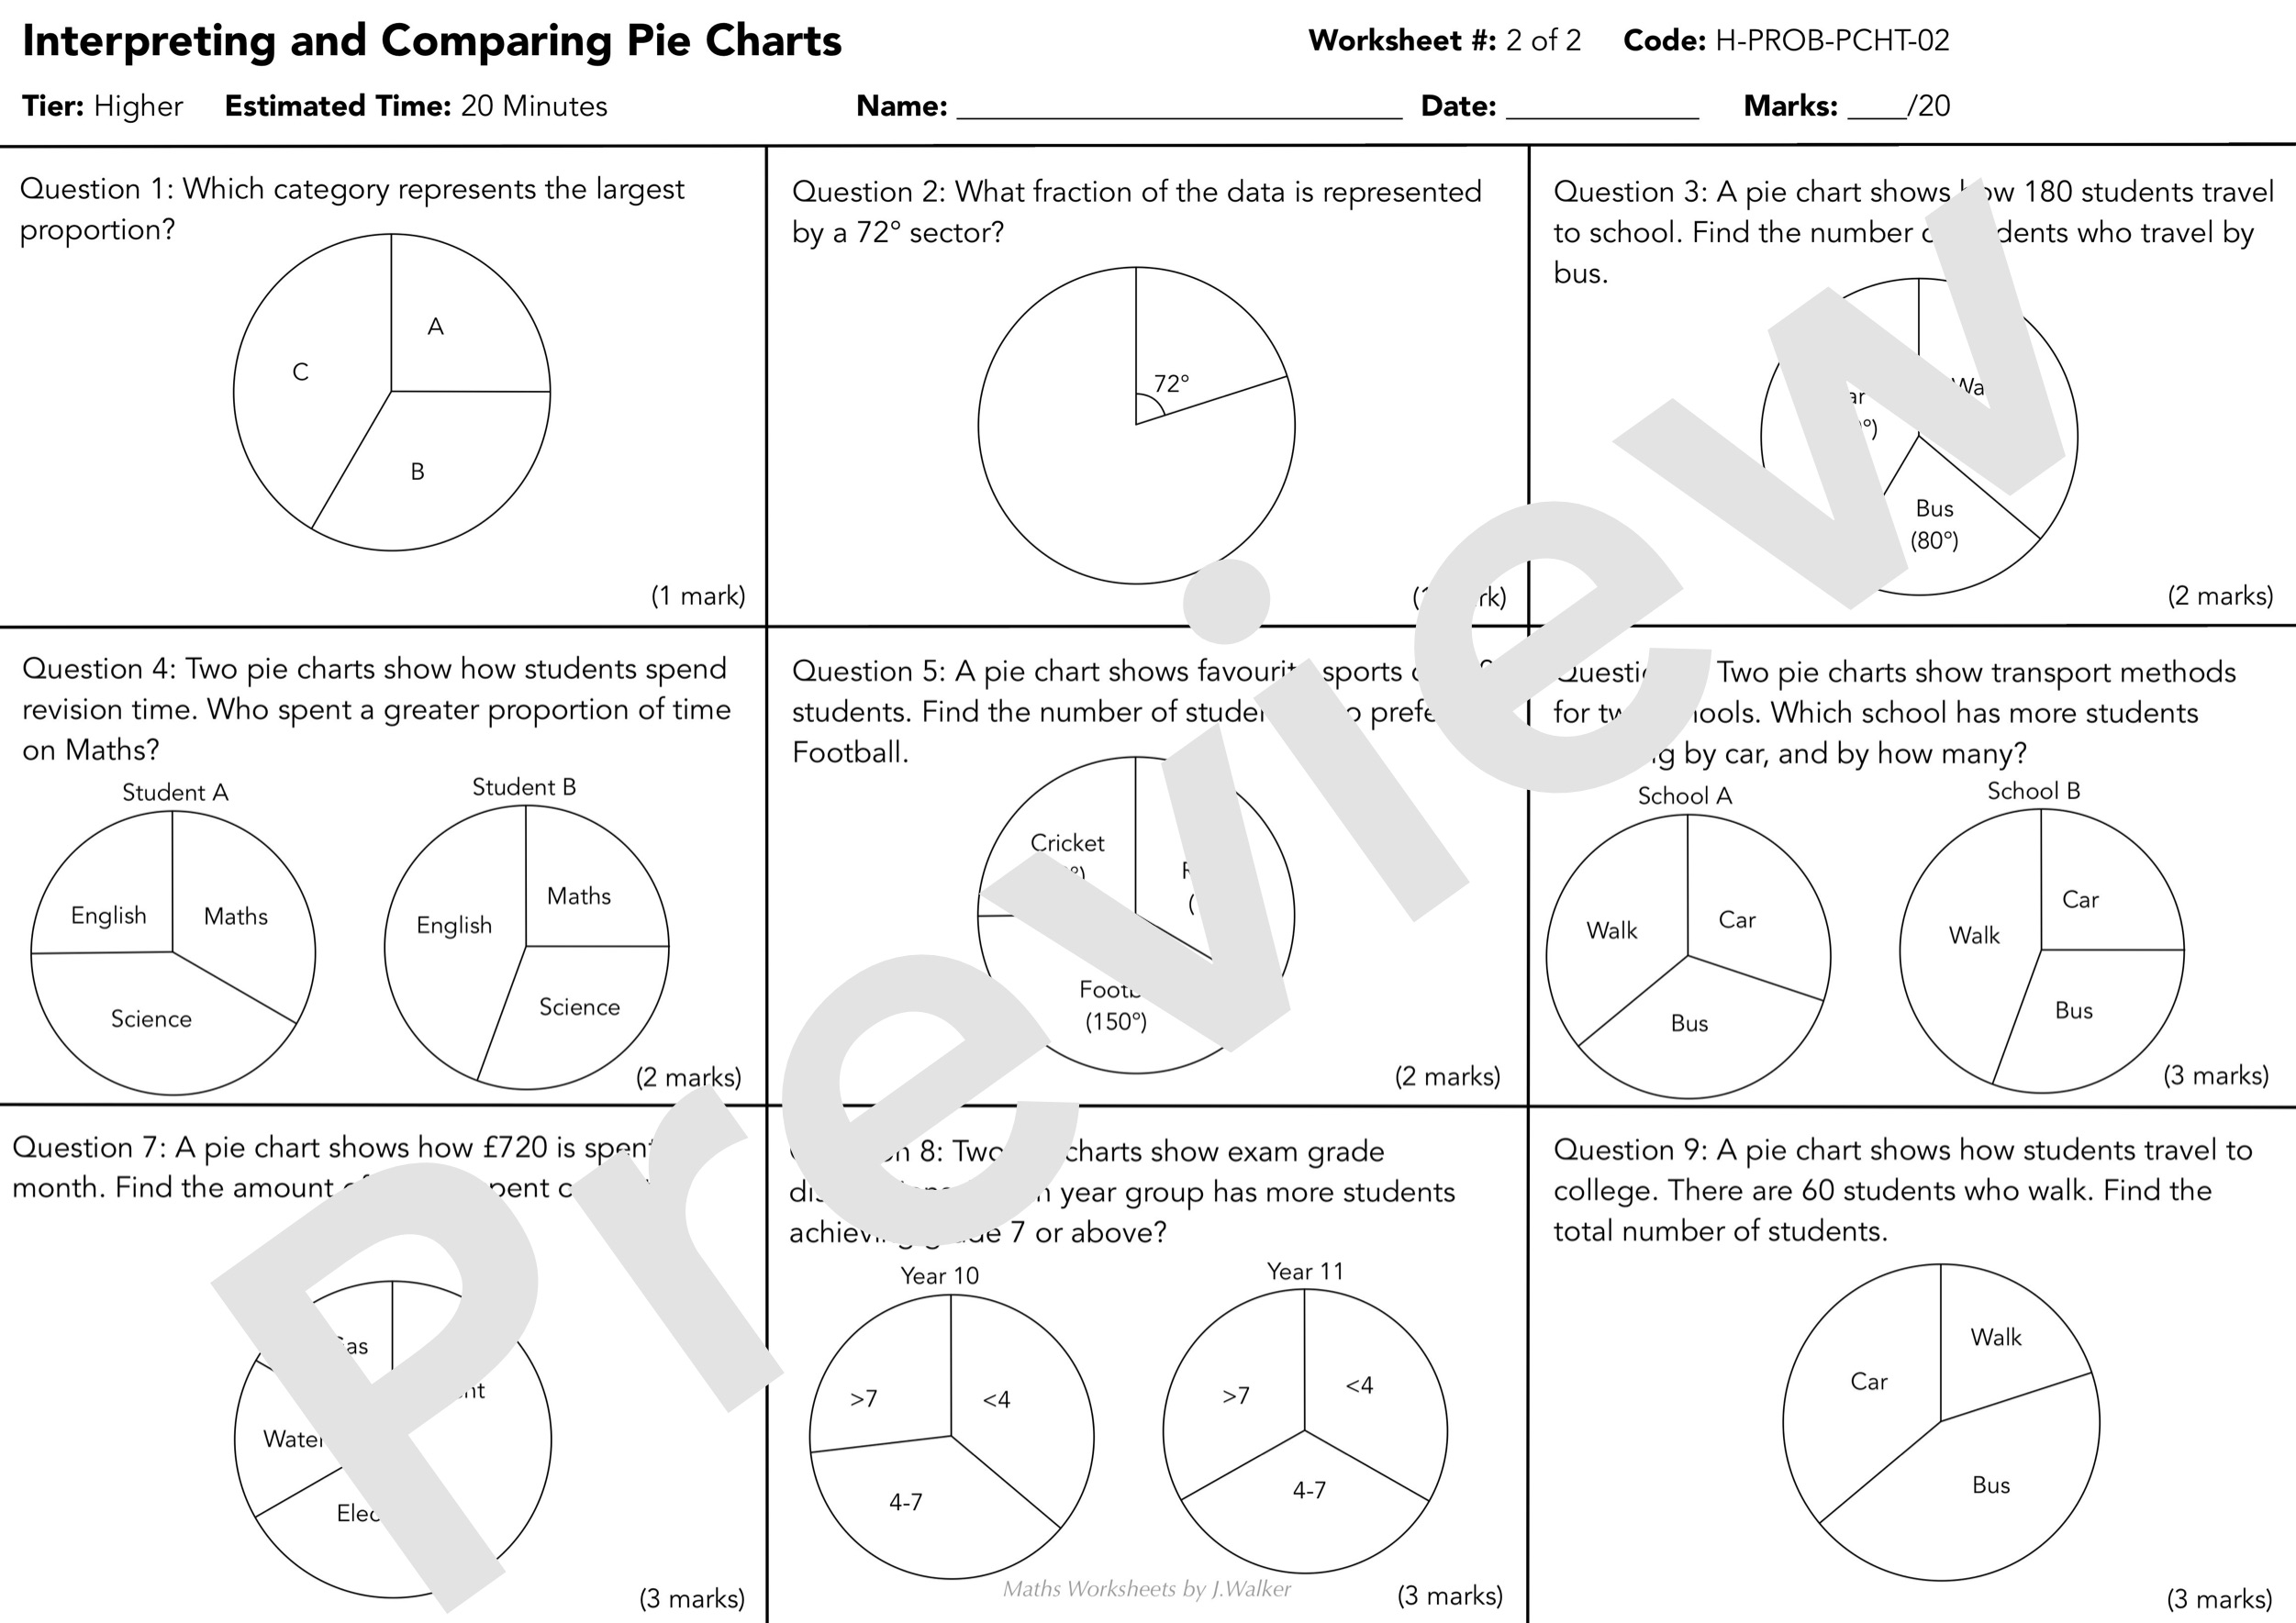
A high-quality GCSE Maths worksheet focusing on exam style questions for interpreting and comparing pie charts, designed for the Higher tier.
What’s included:
Each worksheet contains:
• 9 graded questions arranged by difficulty
• A separate hints page for support
• Full worked solutions
• Clean layout for class, homework, or tutoring use
⸻
Topics covered:
• Interpreting information from pie charts
• Comparing proportions across different pie charts
• Using angles to calculate frequencies and totals
⸻
Ideal for:
• GCSE students studying the AQA or Edexcel specification
• Targeted revision
• Stretch and challenge tasks
• Cover lessons or independent practice
⸻
File Format:
• PDF (3 pages: Questions, Hints, Solutions)
Get this resource as part of a bundle and save up to 20%
A bundle is a package of resources grouped together to teach a particular topic, or a series of lessons, in one place.
Bundle
Statistics Bundle – GCSE Maths (Higher Tier)
Description: A comprehensive bundle of GCSE Maths worksheets focusing on the full statistics strand of the Higher Tier syllabus. Each topic is broken into multiple worksheets to ensure full coverage and progression. ⸻ What’s included: • 8 worksheets across all core probability subtopics • Each worksheet features 9 structured questions, a hints page, and full solutions • Designed for high clarity and student independence ⸻ Topics covered: • Averages • Stem and Leaf Diagrams • Data Representation • Pie Charts • Scatter Graphs • Cumulative Frequency • Box Plots • Histograms ⸻ Why choose this bundle? • Structured, progression-based resources • Covers both procedural fluency and reasoning • Saves planning time and ensures curriculum coverage • Suitable for classroom, homework, and revision use ⸻ • Created by an experienced GCSE Maths teacher to help students build real confidence in number topics. • All resources are printable PDFs with clear layout and consistent design.
£16.80
Bundle
GCSE Maths: Data Representation and Pie Charts Bundle - Higher Tier
Description: A complete bundle of high-quality GCSE Maths worksheets covering all key data representation and pie charts skills for the Higher Tier, ideal for revision, consolidation, or independent study. ⸻ What’s included: Each worksheet contains: • 9 graded questions arranged by difficulty • A separate hints page for support • Full worked solutions • Clean layout for class, homework, or tutoring use ⸻ Topics covered: • Bar charts, pictograms, line graphs • Drawing pie charts from data • Interpreting and comparing pie charts ⸻ Why it’s useful: • Supports mastery through progression • Helps students build confidence with complex fraction problems • Easily printable or usable on-screen • Designed to meet AQA and other major GCSE specs ⸻ • Perfect for teachers, tutors, and students preparing for exams. • Suitable for revision, intervention, or stretch tasks.
£3.60
Something went wrong, please try again later.
This resource hasn't been reviewed yet
To ensure quality for our reviews, only customers who have purchased this resource can review it
Report this resourceto let us know if it violates our terms and conditions.
Our customer service team will review your report and will be in touch.
£1.50