
Completely resourced lesson on velocity-time graphs with key content from AQA and Edexcel Physics.
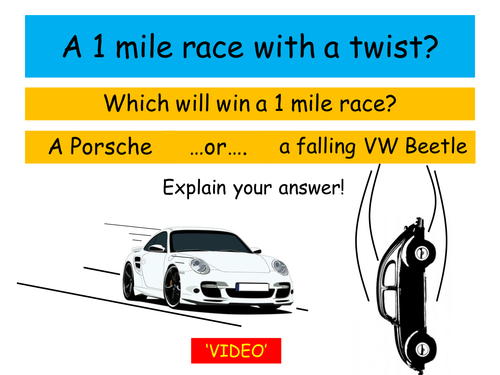
Lesson begins with a starter to get pupils thinking about acceleration whilst recapping terminal velocity.
A prompt questions focuses on cars 0-60 mph time so pupils to discuss what acceleration is and what affects it.
The acceleration equation is covered in detail clearly highlighting the units used - followed by questions to use the equation.
Speed and velocity are contrasted whilst explaining what is meant by vectors and magnitude.
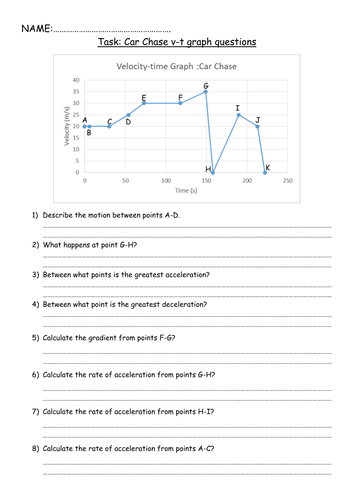
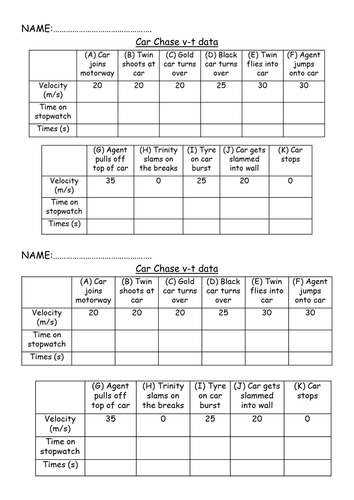
The main task uses a movie car chase sequence for pupils to record the time between key incidents which are associated with a set velocity allowing a v-t graph to be produced, this allow for a discussion of v-t graph trends related to data. Key v-t trends are highlighted following this.
Acceleration is related to the gradient of a v-t graph very clearly as done in the d-t graph lesson. This allows for a more detailed analysis of the car chase v-t graph (worksheet included).
Plenary relates v-t graphs to d-t graphs and uses a v-t graph of a skydive for further questioning (also reviews terminal velocity).
Lesson begins with a starter to get pupils thinking about acceleration whilst recapping terminal velocity.
A prompt questions focuses on cars 0-60 mph time so pupils to discuss what acceleration is and what affects it.
The acceleration equation is covered in detail clearly highlighting the units used - followed by questions to use the equation.
Speed and velocity are contrasted whilst explaining what is meant by vectors and magnitude.
The main task uses a movie car chase sequence for pupils to record the time between key incidents which are associated with a set velocity allowing a v-t graph to be produced, this allow for a discussion of v-t graph trends related to data. Key v-t trends are highlighted following this.
Acceleration is related to the gradient of a v-t graph very clearly as done in the d-t graph lesson. This allows for a more detailed analysis of the car chase v-t graph (worksheet included).
Plenary relates v-t graphs to d-t graphs and uses a v-t graph of a skydive for further questioning (also reviews terminal velocity).
Something went wrong, please try again later.
Fantastic resource and my pupils really enjoyed the video aspect to the lesson!
Report this resourceto let us know if it violates our terms and conditions.
Our customer service team will review your report and will be in touch.
£1.00