
Enhance your pupils’ geographical skills with a series of interpretation and analysis sheets and questions. This resource includes 8 PowerPoint slides with corresponding questions all focused on a different data presentation method. Ideal for preparing your pupils for exams and revising analysis skills. The high quality slides include annotation, examples and five scaled-ability questions.
The data presentation skills included in this resource are:
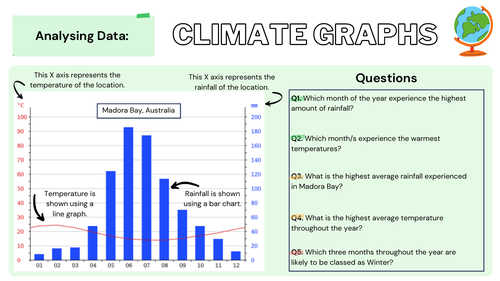
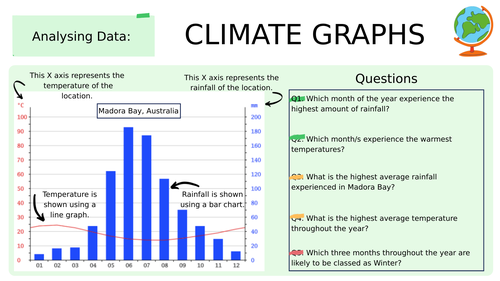
- Climate Graphs
- Population Pyramids
- Choropleth Maps
- Scatter Graphs
- Pie Charts
- Demographic Transition Model
- Proportional Symbols Map
- Divided / Stacked Bar Charts
Resource downloaded in PDF and PowerPoint Format.
Something went wrong, please try again later.
Lovely graphs to analyse. Good resource, pity it doesn't have the answers (which would be great for non-specialists of the subject!).
Clear style with useful skills included. Good basis and will use the simple style to add more skills as a skills blitz for KS3.
Report this resourceto let us know if it violates our terms and conditions.
Our customer service team will review your report and will be in touch.
£2.00