

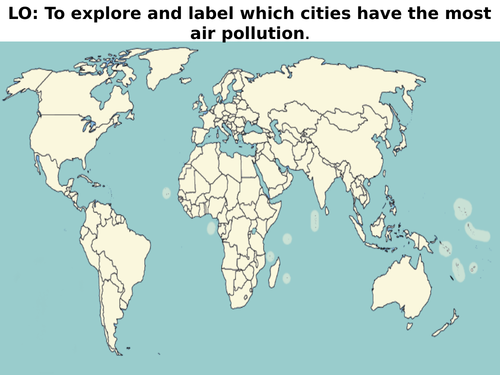
A lesson based around air pollution and most polluted cities by particulate matter concentration. The lesson needs access to the internet and an atlas.
The aim is to research which cities are the most polluted, find them using the atlas index and then transfer that information to a map.
Created by an experienced year 6 teacher and applicable to KS2.
Please click on my name above for other resources and a wide range of SATs revision resources.
This uses an ActivInspire (Promethean) flip chart.
Something went wrong, please try again later.
This resource hasn't been reviewed yet
To ensure quality for our reviews, only customers who have purchased this resource can review it
Report this resourceto let us know if it violates our terms and conditions.
Our customer service team will review your report and will be in touch.
£2.19