

Recognize, analyze and create histograms and box and whisker plots. Scaffolded lesson provides for classroom differentiation. Can be used as a lesson leader, guided practice, independent practice, for cooperative learning and math centers, or as an assessment. Use with smartboard, projector, computer, pad or as printable. Lesson is complete - NO PREP.
Objectives:
- Identify histograms and box and whisker plots
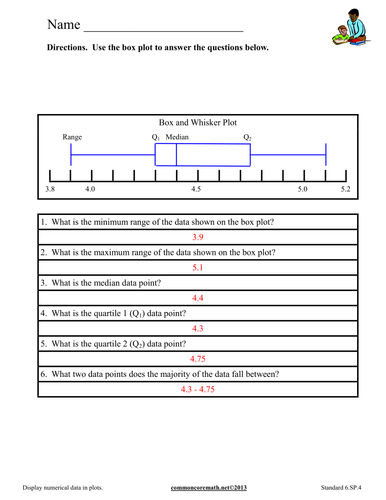
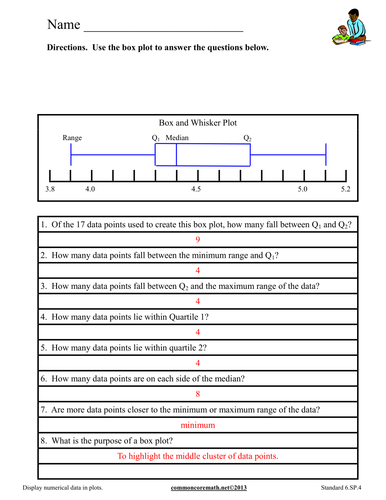
- Analyze data using histograms and box and whisker plots
- Understand when data should be represented in either a histogram or box and whisker plot
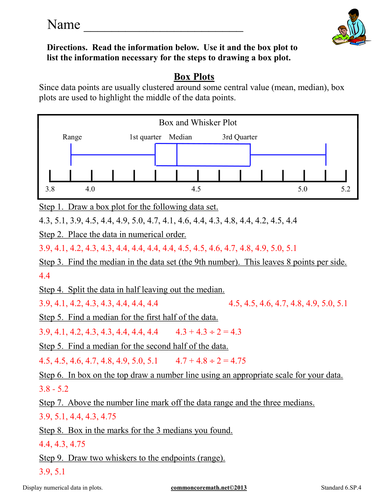
- Given a data set, draw histograms and box and whisker plots
Includes 6 problem pages and answer sheets.
Aligned with NCCS Math - 6.SP.4
Look for more help at commoncoremath.net!
Objectives:
- Identify histograms and box and whisker plots
- Analyze data using histograms and box and whisker plots
- Understand when data should be represented in either a histogram or box and whisker plot
- Given a data set, draw histograms and box and whisker plots
Includes 6 problem pages and answer sheets.
Aligned with NCCS Math - 6.SP.4
Look for more help at commoncoremath.net!
Something went wrong, please try again later.
Thanks for sharing your resource. This is recommended by the TES Content Team.
Report this resourceto let us know if it violates our terms and conditions.
Our customer service team will review your report and will be in touch.
$3.00