


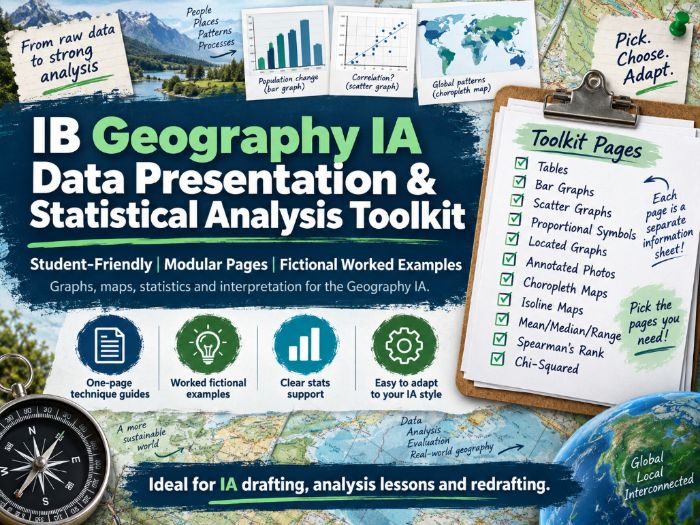
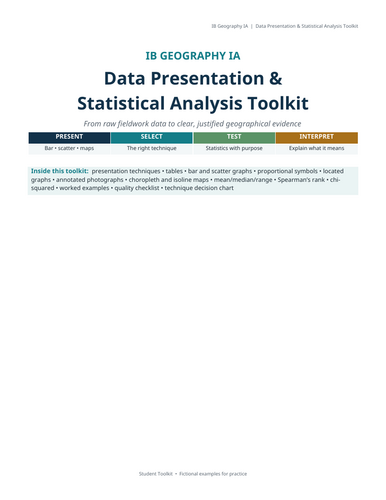
Help students move confidently from raw fieldwork data to clear, justified geographical evidence with this comprehensive IB Geography IA toolkit. Covering data presentation, statistical analysis and interpretation, the resource supports students in choosing techniques for a reason — not simply because a graph or test “looks impressive.”
Designed specifically for the IB Geography Internal Assessment, this substantial 27-page resource combines clear explanations, fictional fieldwork examples, worked calculations, geographical interpretation and practical student checklists.
A major advantage of this toolkit is its flexible page-by-page design. Each data presentation method or statistical technique is presented as its own self-contained information page, allowing teachers to pick and choose exactly what their students need. For example, tables, bar graphs and scatter graphs each have their own dedicated guidance page with when-to-use advice, common mistakes, examples and analysis prompts.
This means you do not need to give students the entire booklet at once. Teachers can:
- give individual pages when a particular technique becomes relevant
- reorder sections to match their own IA teaching sequence
- create personalised packs for different fieldwork investigations
- select only the statistical tests appropriate to their class
- use individual pages as lesson handouts, homework support or revision sheets
- combine pages with their own departmental IA materials
The toolkit covers a wide range of techniques including tables, bar graphs, scatter graphs, proportional symbols, located graphs, annotated photographs, choropleth maps and isoline maps, alongside mean, median, range, Spearman’s rank and chi-squared.
Students are also encouraged to think carefully about which technique best matches their data and geographical question, with guidance on whether they are comparing categories, investigating relationships, showing spatial variation or testing association.
The resource includes worked fictional fieldwork examples, so students can see not only how techniques are constructed but also how results should be interpreted geographically. For example, the scatter-graph section encourages students to consider direction, strength, outliers, geographical mechanisms and whether Spearman’s rank would be appropriate.
Also included are practical quality checks, decision-making guidance and support with avoiding common IA mistakes such as using inappropriate graphs, confusing correlation with causation, or applying statistics without geographical interpretation.
Ideal for IB Geography SL and HL, IA preparation lessons, post-fieldwork workshops, independent student support, draft improvement and final submission preparation.
Format: Editable Microsoft Word document
Length: 27 pages
Best feature: Modular, one-technique-per-page design — easy to adapt to individual teacher IA styles and fieldwork programmes.
Something went wrong, please try again later.
This resource hasn't been reviewed yet
To ensure quality for our reviews, only customers who have purchased this resource can review it
Report this resourceto let us know if it violates our terms and conditions.
Our customer service team will review your report and will be in touch.
£5.00