


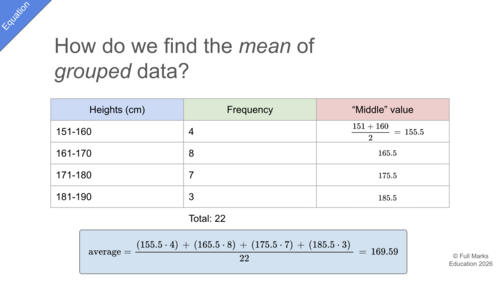
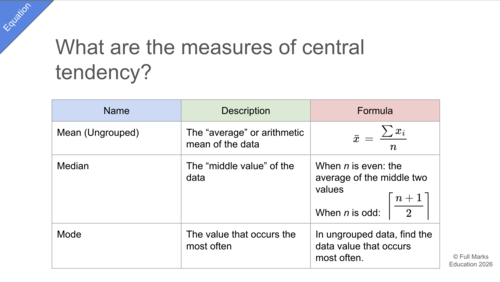
This IB Maths AA SL Topic 4.3 – Summary Statistics resource develops students’ ability to calculate and interpret key measures of central tendency and dispersion. It begins by reviewing the mean, median, and mode for ungrouped data before extending these ideas to grouped frequency tables. Students learn how to estimate the mean using class midpoints and identify the modal class as the interval with the greatest frequency.
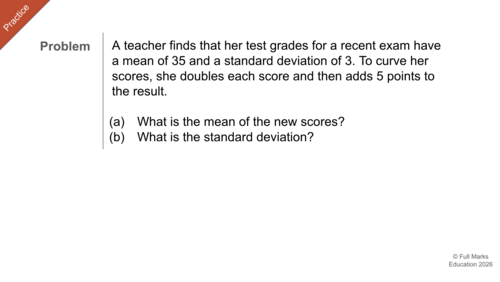
The lesson also introduces the interquartile range, variance, and standard deviation as measures of data spread. Students explore how linear transformations affect summary statistics, including how adding a constant changes the mean but not the standard deviation, while multiplying all values changes the mean and standard deviation by the same scale factor and changes the variance by the square of that factor. The resource also develops confidence in finding medians and quartiles from discrete datasets using both manual methods and technology, with detailed instructions for the TI-Nspire CX/CX II and Casio fx-CG50. With clear formula summaries, worked examples, transformation problems, calculator guidance, practice questions, and fully worked solutions, this resource helps SL students build strong statistical reasoning in line with IB Mathematics AA expectations.
Something went wrong, please try again later.
This resource hasn't been reviewed yet
To ensure quality for our reviews, only customers who have purchased this resource can review it
Report this resourceto let us know if it violates our terms and conditions.
Our customer service team will review your report and will be in touch.
£3.00