


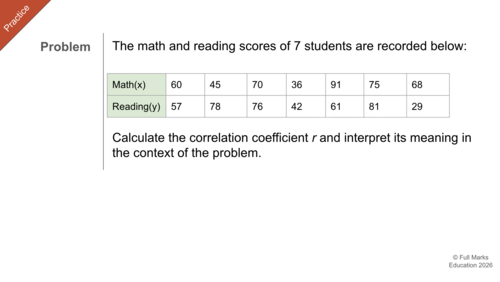
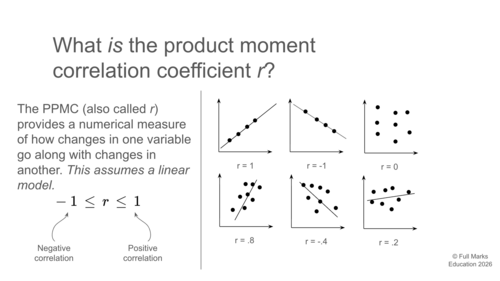
This IB Maths AA SL Topic 4.4 – Correlation and Regression resource develops students’ ability to analyse relationships between two variables using scatter plots, correlation coefficients, and linear regression. It begins by introducing Pearson’s product-moment correlation coefficient, r, as a measure of the strength and direction of a linear relationship. Students practise calculating r using technology and interpreting positive, negative, strong, weak, and near-zero correlations in context.
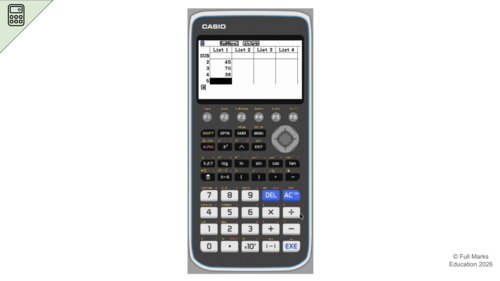
The lesson also introduces Spearman’s rank correlation coefficient, rs, and explains how it measures monotonic relationships by comparing the ranks of two variables. Students then learn how to calculate and interpret a regression line of y on x, including the meaning of the gradient and y-intercept in context. They use regression models to make predictions and distinguish between interpolation, which occurs within the observed data range, and extrapolation, which is generally less reliable. With clear visual examples, worked problems, contextual interpretations, and detailed calculator instructions for the TI-Nspire CX/CX II and Casio fx-CG50, this resource helps SL students build strong statistical modelling and data-analysis skills in line with IB Mathematics AA expectations.
Something went wrong, please try again later.
This resource hasn't been reviewed yet
To ensure quality for our reviews, only customers who have purchased this resource can review it
Report this resourceto let us know if it violates our terms and conditions.
Our customer service team will review your report and will be in touch.
£3.00