


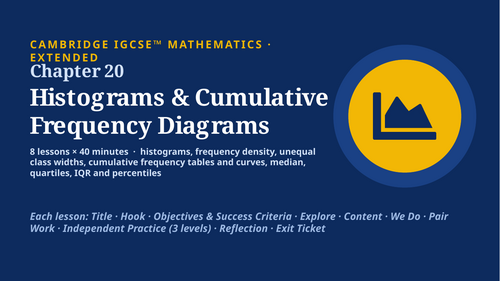
The PowerPoint has 8 lessons of 40 minutes each, 90 slides in total, in the same order and with the same bold, large text as your other chapters. As in Chapter 13, each lesson has one extra exam-style question slide straight after the challenge slide. It has marks shown per part, and you click to reveal the mark scheme step by step.
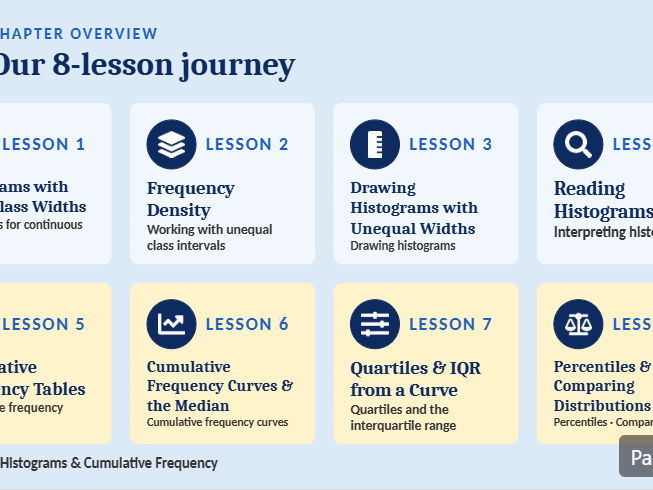
The lessons run from equal-width histograms, through frequency density and drawing and reading histograms with unequal widths, to cumulative frequency tables and curves, the median, quartiles and IQR, and percentiles.
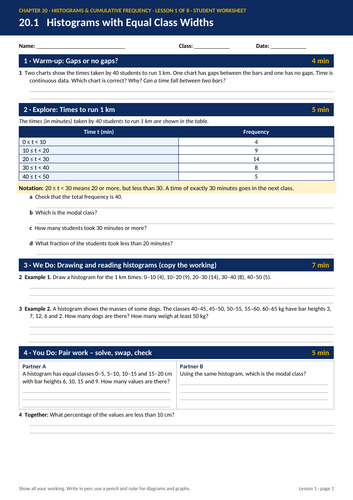
The worksheets are 2 pages per lesson (16 pages in all) and use the questions from the slides, including the exam-style question. Every “draw a histogram” or “draw a curve” question has a blank grid next to it for students to draw on.
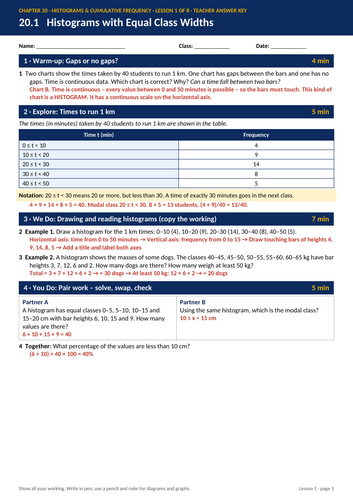
The answer key has the same layout with all the answers filled in.
On the worksheets for Lessons 3 and 6, the text is slightly smaller (9.5pt) so the drawing grids still fit on 2 pages.
The 40-minute lesson plan on each title slide doesn’t count the 2-minute exam question. You can take those 2 minutes from Reflection or Explore, or use the exam question as a starter for the next lesson.
Files are in your outputs folder:
Chapter20_Histograms_Cumulative_Frequency_Lessons.pptx
Ch20_Student_Worksheets_Lessons_1-8.pdf
Ch20_Worksheets_Teacher_Answer_Key.pdf
Something went wrong, please try again later.
This resource hasn't been reviewed yet
To ensure quality for our reviews, only customers who have purchased this resource can review it
Report this resourceto let us know if it violates our terms and conditions.
Our customer service team will review your report and will be in touch.
£5.00